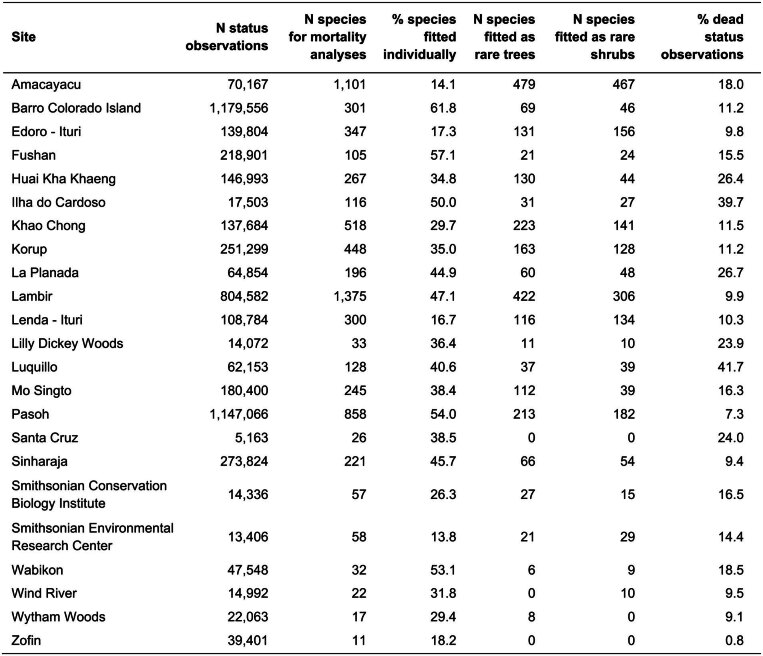
Extended Data Table 1.
Summary information of the data used in mortality models per forest plot
Observations for the mortality analyses (N status observations) were selected as follows: (1) no fern or palm species, (2) no missing information on coordinates, species, status, or date of measurement, (3) alive in the first census and alive or dead in the consecutive census, (4) DBH between 1 and 10 cm in the first census, (5) more than 30 m away from the plot boundaries. From the total number of species in the mortality dataset (N species for mortality analyses), only some proportion could be successfully fit (% species fitted individually). The remaining species were jointly fitted in species groups (N species fitted as rare trees or shrubs): these were species with fewer than 20 alive and dead observations each, species with fewer than four unique values of conspecific density, species with a range of conspecific density values not including the value used to calculate average marginal effects, or species for which no convergence of the mortality model was achieved. In some cases, also the mortality model for a species group did not converge (indicated by N = 0 in the respective column). Note that the percentage of dead trees (% dead status observations) does not correspond to mortality rates because of varying interval lengths. Numbers of species can include morphospecies. Note that for the Pasoh site, each stem was counted as an individual tree (see ‘Forest data’ in Methods).

