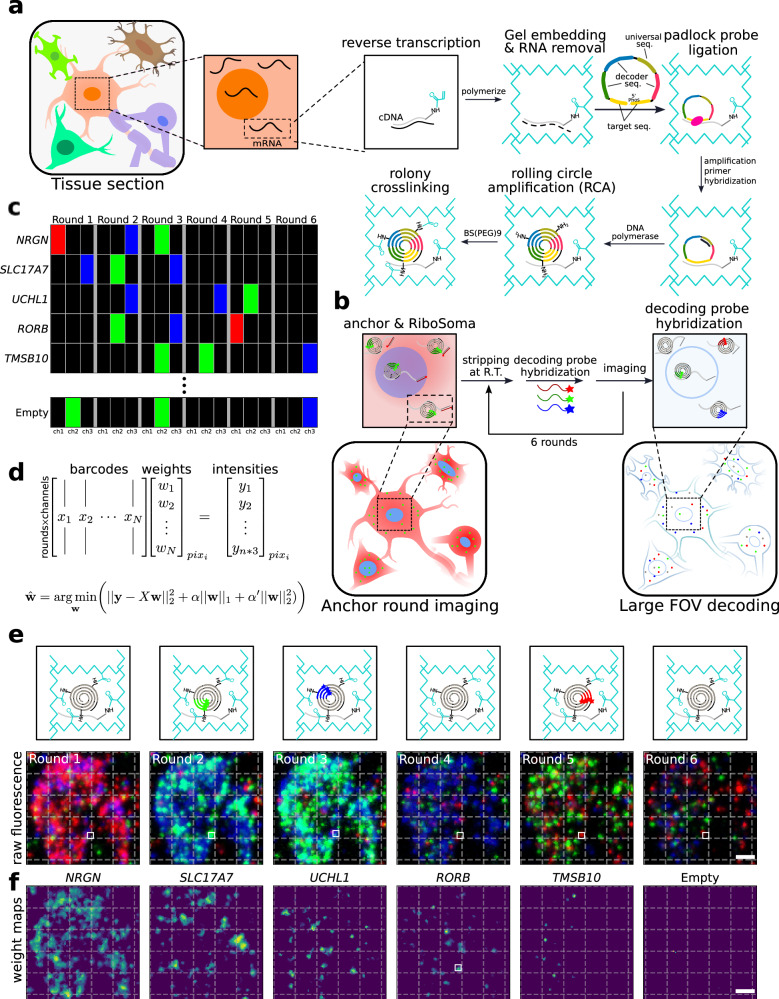
Fig. 1. DART-FISH workflow.
a Schematics of DART-FISH. RNA molecules in a fresh-frozen and formaldehyde-fixed tissue section were reverse-transcribed with primers carrying a 5’ handle with an acrydite modification. A polyacrylamide (PA) gel was cast on the tissue, incorporating the cDNA molecules in the gel matrix. After RNA removal, padlock probes were hybridized to cDNA and circularized, followed by rolling circle amplification (RCA) to create rolonies. Rolonies were further crosslinked to the gel. b Imaging DART-FISH samples. Samples went through anchor round imaging followed by decoding rounds. In anchor round imaging, fluorescent probes complementary to the universal sequence and the 5’ cDNA handle, present on all cDNA molecules, were hybridized at room temperature to visualize the distribution of rolonies and the shape of the somas (RiboSoma), respectively. After imaging, the fluorescent probes were stripped and washed away at room temperature. In the subsequent decoding rounds, round-specific decoding probes were hybridized, imaged and stripped. This procedure was repeated times ( in this example). c An example codebook for DART-FISH. Each gene was barcoded such that the corresponding rolonies show fluorescent signal in ( in this example) rounds of decoding and remain off in other rounds. 5–10% of the codebook consists of empty barcodes that do not have representative padlock probes and were only used for quality control in the decoding pipeline. d SparseDeconvolution (SpD) decoding algorithm. The intensity of pixels across rounds of 3-channel imaging was modeled as a weighted combination of the barcodes in the codebook. The decoding was formulated as a regularized linear regression such that most barcodes do not contribute to the observed intensity. e Example of decoding by FISH on the PA gel. The lower panel shows the maximum intensity projection of the fluorescent images across 6 decoding rounds and 3 channels (scale bar 5 μm). The upper panel is a cartoon drawing depicting the decoding of a RORB spot corresponding to the white square. f Lasso maps. Lasso maps are the solutions to the optimization in d and represent the gene weights for each of NRGN, SLC17A7, UCHL1, RORB, TMSB10, and an Empty barcode in e (scale bar 5 μm).

