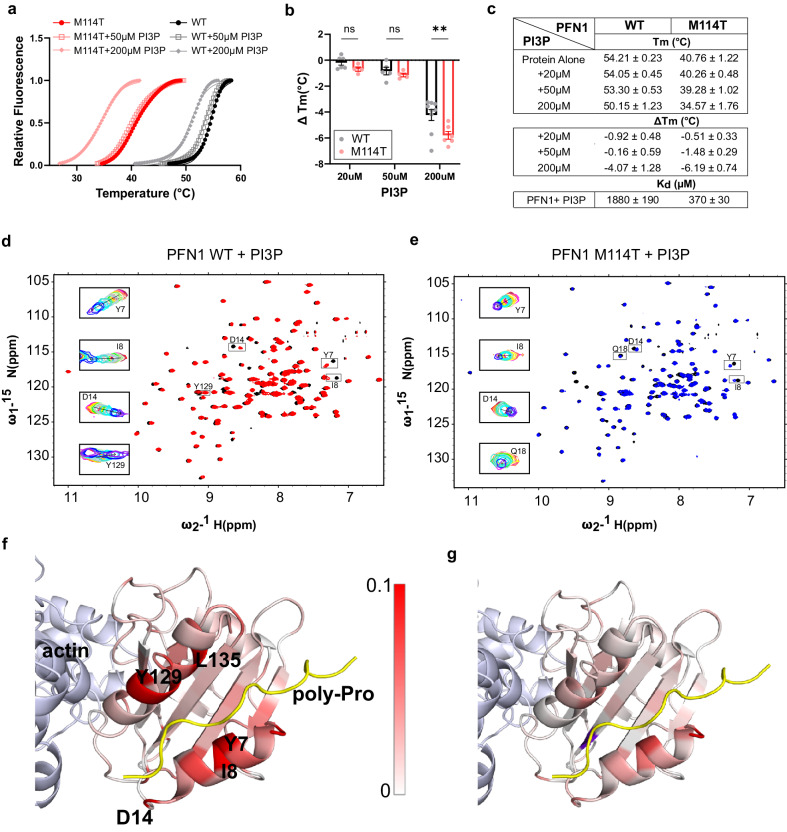
Fig. 9. PI3P is a PFN1 ligand with enhanced binding affinity for PFN1 M114T.
a, b Differential scanning fluorimetry (DSF) with PFN1 WT and M114T proteins in the presence of PI3P. a Thermal denaturation profiles of PFN1 proteins incubated with PI3P measured by SYPRO Orange fluorescence as a function of increasing temperature. An average of two technical replicates is shown and is representative of n = 4–9 independent experiments. The curves were fit to the Boltzmann’s sigmoidal function to determine the apparent melting temperature (Tm). b ΔTm reports the difference between the Tm at the indicated PI3P concentration and the protein without PI3P. Statistics were determined using two-way ANOVA F (1, 28) = 7.115 and Šídák’s multiple comparisons test (**P = 0.0038 for 200 µM and ns P = 0.735 for 50 µM or 0.9326 for 20 µM) for WT n = 9 and M114T n = 8 independent experiments using different PI3P concentrations as described in the Source Data file. Bar graphs show mean ± SEM with each data point representing an independent experiment. c Summary of Tm and ΔTm obtained from (b) and the dissociation constants from the NMR studies (d–g) for PFN1 WT and M114T with PI3P. d–g Titration of PFN1 with PI3P using NMR. d Overlay of 15N-1H HSQC spectra of PFN1 free (black) and bound to PI3P (red) for PFN1 WT. e the same as (d) except for PFN1 M114T in the free state (black) and bound to PI3P (blue). d, e Insets show the overlay of spectra collected during the titration of PI3P for select residues. f, g Chemical shift differences between spectra of PFN1 alone and the PI3P-PFN1 complex are mapped onto the structure of PFN1 in the ternary complex with actin (light blue) and PLP (yellow); pdb ID 2PAV for PFN1 WT (f) and PFN1 M114T PFN1 (g). Residues are colored according to the chemical shift perturbation measured upon PI3P binding as indicated by the scale bar, with white and red corresponding to 0–0.1 ppm, respectively. PFN1 residues presenting chemical shift perturbations ≥0.1 ppm are shown in red. Additional information is in Supplementary Fig. 15. Source data are provided as a Source Data file.

