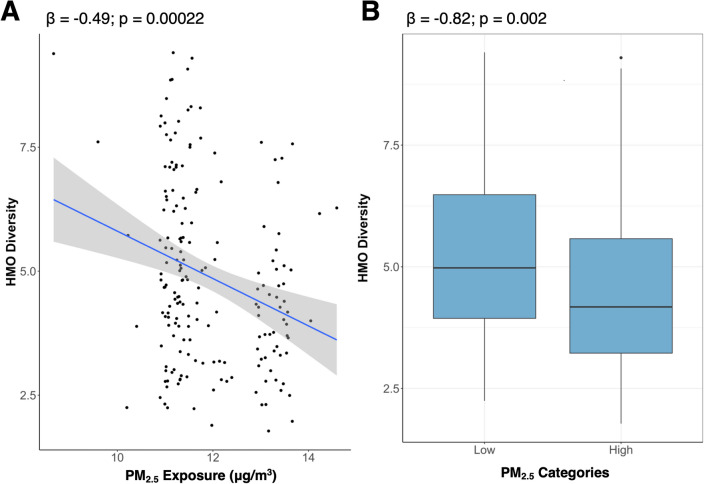
Figure 3.
Higher exposure PM2.5 was associated with lower HMO diversity. (A) Figure shows the associations between PM2.5 exposure and HMO diversity. (A) Effect estimates (β) and unadjusted p values from the multivariate linear regression models are shown on the unadjusted plot. The effect estimate (β) is reported for a one standard deviation increase in PM2.5 exposure (SD: 1.02 µg/). (B) Boxplots for HMO diversity in the high and lower PM2.5 exposure groups. Effect estimates (β) and unadjusted p values from the multivariate linear regression models are shown on the unadjusted boxplot. All models adjusted for maternal age and socioeconomic status.

