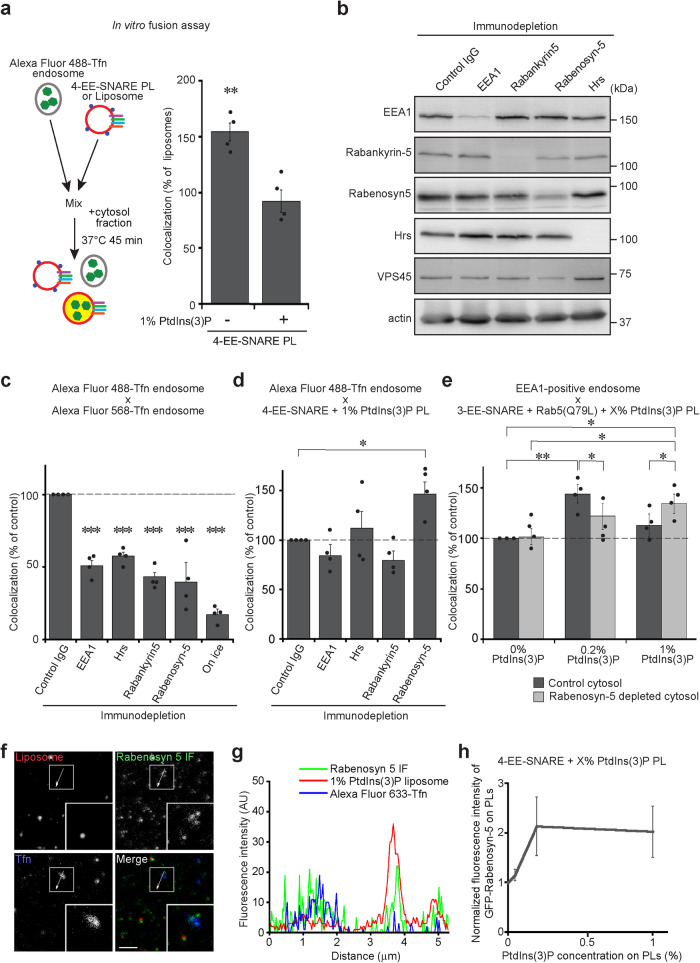
Fig. 4. Rabenosyn-5 contributes to inhibition of SNARE dependent targeting.
a In vitro fusion assay between liposomes containing early endosomal SNAREs (4-EE-SNARE PL) and early endosomes, labeled by incubation with fluorescent transferrin. Values were normalized to the degree of colocalization observed in control protein-free liposomes. Inclusion of 1% PtdIns(3)P in the membrane of 4-EE-SNARE-PL inhibits fusion. The data show mean values ± SEM of 4 independent experiments. At least 100 liposomes were analyzed for the colocalization with Transferrin-positive endosomes in each experiment. **P < 0.01, determined by an unpaired two-tailed t-test. b Immunoblot showing effective immunodepletion of PtdIns(3)P binding proteins from HeLa cell-derived cytosol fractions. VPS45, which is a SM protein, co-depleted only in Rabenosyn-5 depleted cytosol. Actin was loading control. Same experiments were independently performed three times. c Depletion of the PtdIns(3)P binding proteins significantly inhibited homotypic fusion of endosomes in vitro. d In vitro fusion assay between 1% PtdIns(3)P liposomes containing early endosomal SNAREs (4-EE-SNARE PL) and early endosomes as in (a) using immunodepleted cytosol fractions. e In vitro fusion assay as in (a) using EE-SNARE liposomes reconstituted with Rab5(Q79L) and increasing concentrations of PtdIns(3)P. Note that in this experiment we used EEA1 as marker for early endosomes. The data in (c–e) show mean values ± SEM of 4 independent experiments. At least 100 liposomes were analyzed for the colocalization with Transferrin-positive endosomes in each experiment. *P < 0.05, **P < 0.01, ***P < 0.001, all determined by 1-way ANOVA with the Tukey multiple comparison test. f Comparison of Rabenosyn-5 protein levels between injected 1% PtdIns(3)P liposomes and endogenous Transferrin-positive endosomes in cells. To label early endosomes, Alexa Fluor 633-Transferrin was internalized, and then 1% PtdIns(3)P liposomes were microinjected followed by immunostaining (IF) for Rabenosyn-5. Inserts show a higher magnification of the area surrounded by white boxes. Same experiments were independently performed two times and images were captured from four different cells in each experiment. Scale bar, 5 µm. g An intensity plot of the line scan (a white line) in the pictures on (f). h Microscopy-based detection of GFP-Rabenosyn-5 recruitment to liposomes. The data show mean values ± SEM of 6 independent experiments. Source data are provided as a Source Data file.

