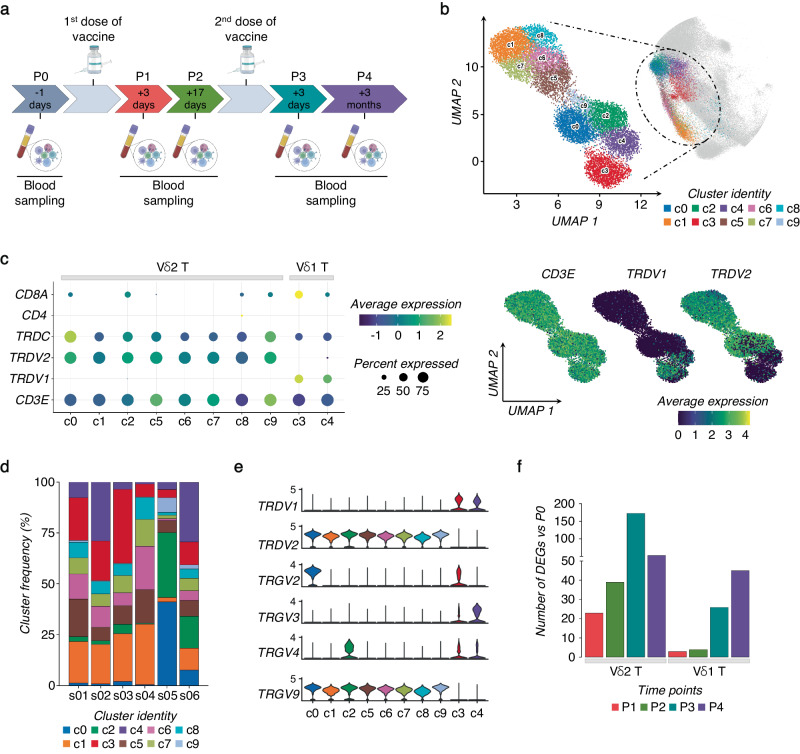
Fig. 1. Activation of γδ T cells following SARS-CoV-2 vaccination.
a Schematic overview of the experimental design. b UMAP clustering projection of the integrated PB γδ T cells from all subjects (s01-s06; a total of 12640 γδ T cells). c The dot plot (left panel) and feature plots (right panel) show the expression of canonical markers used for the annotation of γδ T cell subtypes. d The bar plot shows the frequency (%) of cell cluster (c0-c9) distribution across all subjects. Cell numbers were normalized to the total number of cells per subject loaded independently from the time point. e The violin plots show the expression of the main TCR γ chains (TRGV) associated with either δ1 (TRDV1) or δ2 (TRDV2) chains per cluster. f The bar plot shows the number of identified DEGs across different time points (P1-P4) after vaccination, compared to pre-vaccine P0. For all figures, DEGs were defined as follows: (i) absolute value of average |Log2- FC| ≥ 0.25 for up- and down-regulated genes; (ii) adjusted P values (adj.p) ≤ 0.05, and (iii) detected not less than 10% of cells (min.pct ≥ 10%).

