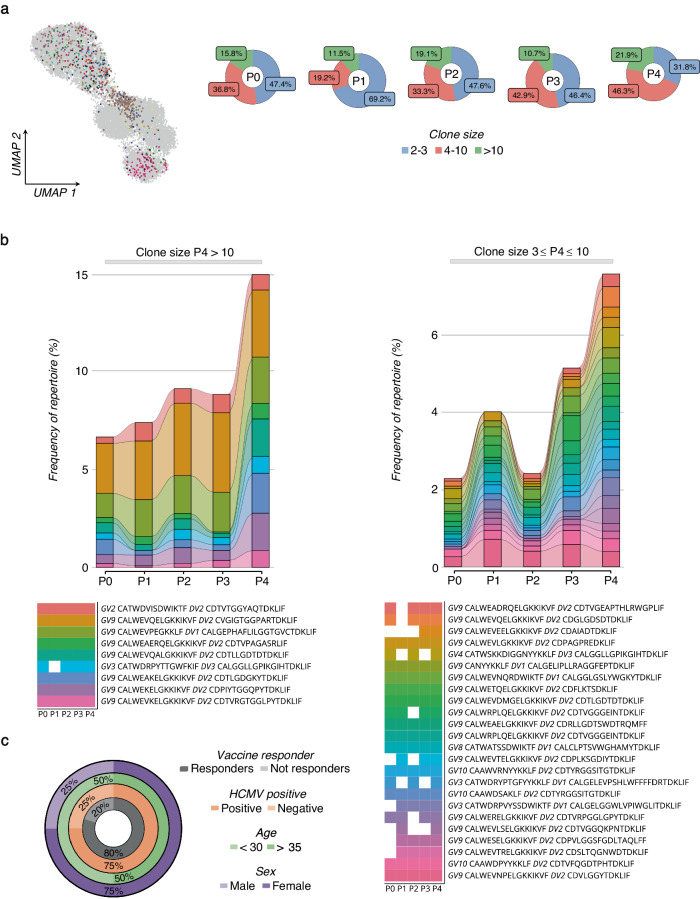
Fig. 7. Expansion of γδ TCR clones upon SARS-CoV-2 vaccination.
a UMAP visualization (left panel) of all identified and expanded γδ TCR clones with a cell size ≥2. Each color represents a different clonotype. The pie charts (right panel) show the percentage frequency distribution of the expanded γδ TCR clones grouped by cell sizes across all the time points (P0-P4). b The two alluvion plots show the longitudinal tracking of the expanded γδ TCR clones, grouped by the cell size, ≥3 - ≤10 (left panel) and >10 (right panel). Each stratum represents a unique γδ TCR clonotype highlighted by a different color. The time point distribution (P0-P4) and sequence of each clonotype are reported below. c The nested pie chart shows the frequencies (%) of subjects who responded to the vaccine with clonal expansion among all the analyzed individuals (inner gray chart). The distribution of HCMV seropositive status, age, and sex among responsive subjects is represented in the colored charts, progressing from the innermost to the outermost circles, which are colored in orange, green, and violet, respectively.

