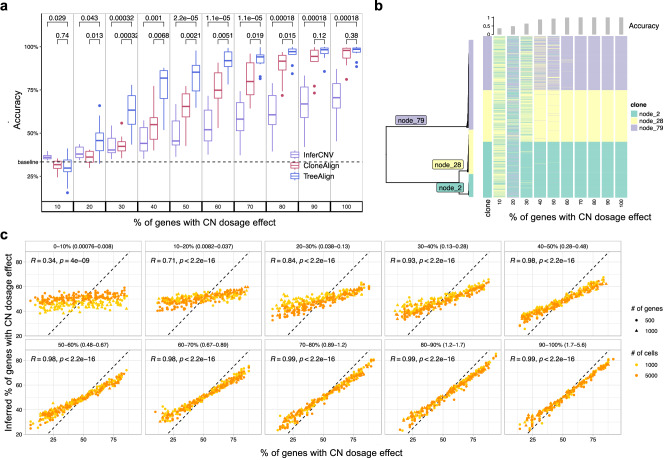
Fig. 2. Performance of TreeAlign on simulated data.
a Clone assignment accuracy of TreeAlign, CloneAlign and InferCNV on simulated datasets (500 cells, 1000 genes, 3 clones) containing varying proportions of genes with CN dosage effects. Brackets: P values with two-sided Wilcoxon signed-rank test. For the box plot, box limits extend from the 25th to 75th percentile, while the middle line represents the median. Whiskers extend to the largest value no further than 1.5 times the inter-quartile range (IQR) from each box hinge. Points beyond the whiskers are outliers. b Phylogenetic tree (left) of cells from patient 081 constructed using scDNA data. Heat map (right) of clone assignment by TreeAlign. Each column shows the assignment of simulated expression profiles to subtrees of the phylogeny. The bar chart above shows the overall accuracy of clone assignment. c Scatter plots comparing inferred gene dosage effect frequencies and the simulated frequencies. Each panel groups genes with similar expression levels from low expression genes (0–10%, with normalized expression between 0.00076–0.008) to high expression genes (90–100%, with normalized expression between 1.7 and 5.6). Pearson correlation coefficients (R) and P values for the linear fit (Two-sided Student’s t-test) are shown. Source data are provided as a Source Data file.

