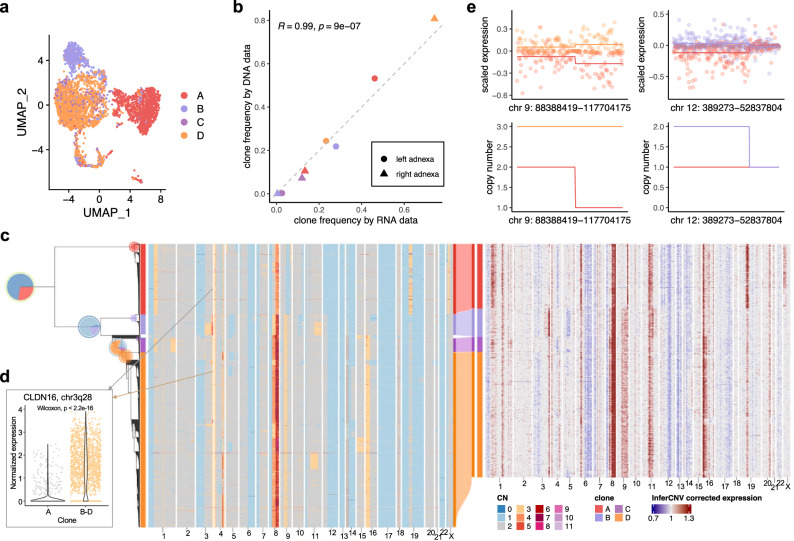
Fig. 3. TreeAlign assigns HGSC expression profiles to phylogeny accurately.
a UMAP plot of scRNA-data from patient 022 colored by clone labels assigned by TreeAlign. b Correlation between clone frequencies of patient 022 estimated by scRNA-data (x axis) and scDNA data (y axis). Pearson correlation coefficients (R) and P values for the linear fit (Two-sided Student’s t-test) are shown. c Single cell phylogenetic tree of patient 022 constructed with scDNA data (left). Pie charts on the tree showing how TreeAlign assigns cell expression profiles to subtrees recursively. The pie charts are colored by the proportions of cell expression profiles assigned to downstream subtrees. The outer ring color of the pie charts denotes the current subtree. For example, the leftmost pie chart represents the proportions of cells assigned to the two main subtrees. The outer ring represents the root of the phylogeny. The red proportion of the pie chart represents the subtree on the top or clone A. The blue proportion represents the bottom subtree which contains clone B, C and D. Left heat map, total copy number from scDNA; right heat map, InferCNV corrected expression from scRNA; middle Sankey chart, clone assignments from RNA to DNA. d Normalized expression of CLDN16 in clone A and clone B-D (Two-sided Wilcoxon signed-rank test). Source data are provided as a Source Data file. e Scaled expression and copy number profiles for regions on chromosome 9 and 12 as a function of genes ordered by genomic location.

