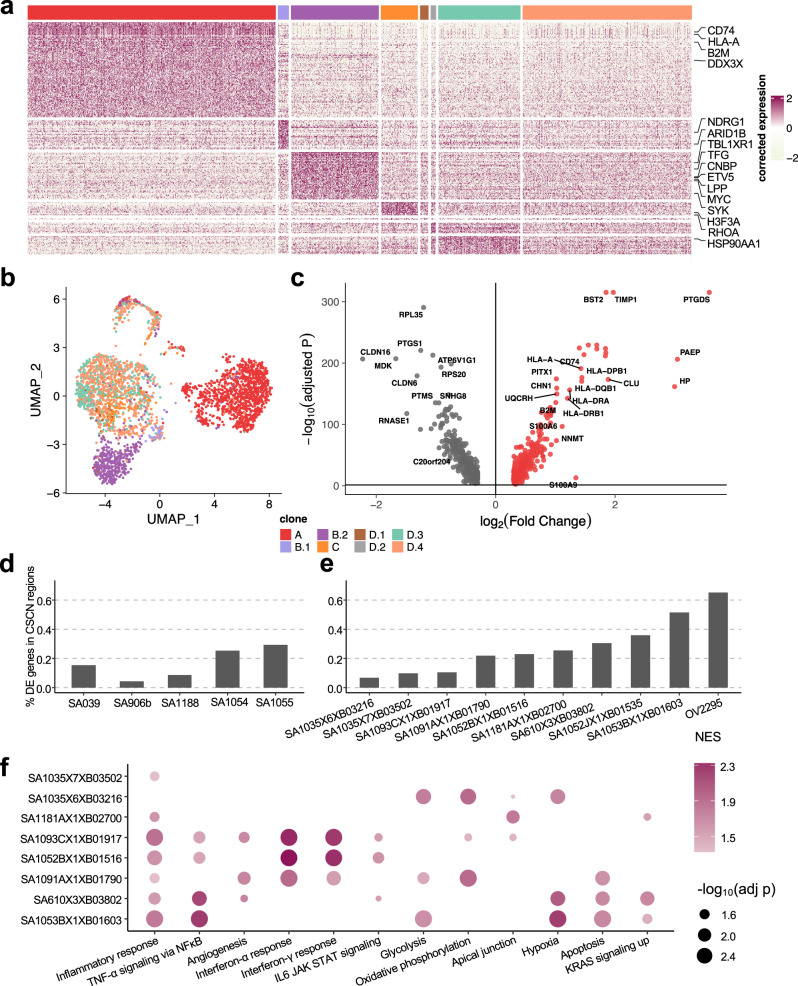
Fig. 6. Clone-specific transcriptional profiles highlight clonal divergence in immune pathways.
a Scaled expression of upregulated genes in each subclone in patient 022, showing genes in rows and subclones in columns. Genes in the COSMIC Cancer Gene Census35 are highlighted. b UMAP embedding of expression profiles from patient 022 colored by clone labels assigned by integrated TreeAlign model. c Differentially expressed genes between clone A and other subclones (clone B-D) in patient 022. Adjusted P values were calculated by MAST37. Proportions of subclonal differentially expressed genes located in CSCN regions for d 184-hTERT cell lines, e an HGSC control cell line and PDXs. f Pathways with clone-specific expression patterns in TNBC and HGSC PDXs. Source data are provided as a Source Data file.

