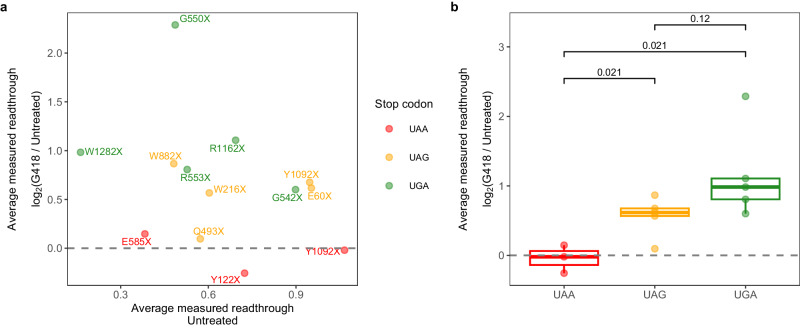
Fig. 5. UAA PTC alleles do not respond well to G418-treatment.
Response to G418 treatment is defined as log2 fold-change of readthrough for each replicate of G418-treated over the untreated condition and then averaged (4–7 replicates). a Average response to G418 treatment vs. average basal readthrough level in an untreated condition. b Average response to G418 treatment vs. stop codon identity. Box-plot center line, median; lower and upper hinges, first and third quartiles (the 25th and 75th percentile); whiskers, 1.5× interquartile range; points, actual data. Two-tailed Student’s t-test with the Benjamini–Hochberg method for multiple testing correction was used to perform the pairwise comparison. Source data are provided as a Source Data file and Supplementary Data 1.

