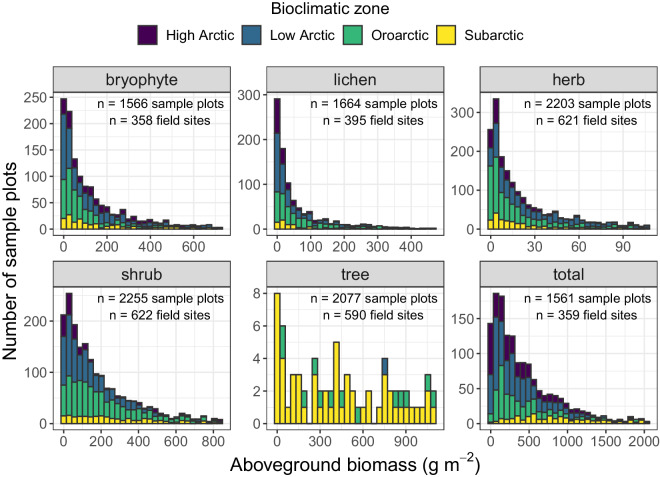
Fig. 4.
Frequency distribution of plant aboveground biomass (g m−2) by functional type for sample plots in The Arctic plant aboveground biomass synthesis dataset. To improve clarity, (1) the x-axis is limited to 95% of the maximum range in aboveground biomass for each plant functional type, and (2) sample plots are not shown if there was no biomass (i.e., 0 g m−2) for the plant functional type. The total number of sample plots and field sites with biomass measurements is provided for each plant functional type.

