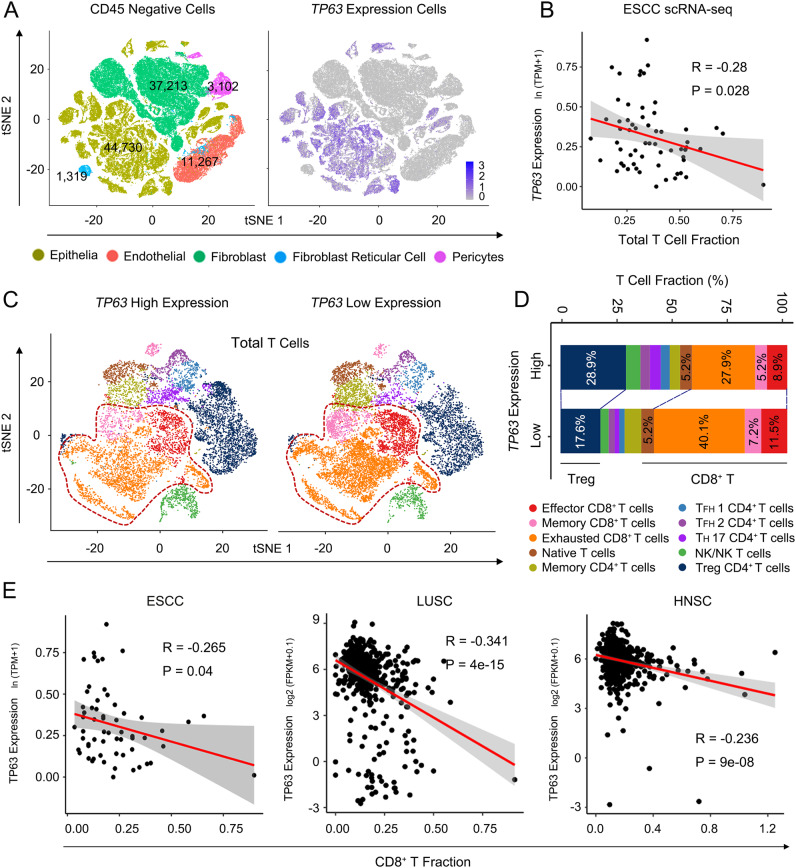
Fig. 3. TP63 expression level is negatively correlated with CD8+ T cell infiltration in ESCC patient tumors.
A t-SNE plots of 97,631 CD45- cells in 60 human ESCC tumor and 4 adjacent normal tissue samples, colored by cell types (left) or TP63 expression level (right). scRNA-seq dataset (GSE160269) and cell annotations were obtained from Zhang et al. 20. B Scatter plot showing a negative correlation between total T cell fraction and TP63 expression. The average TP63 expression in CD45− cells in each tumor was calculated, n = 60 independent ESCC patients. C t-SNE plots of the clustering of T cells in 9 TP63-high vs. 9 TP63-low tumor samples. D The fraction of T cell subgroups in TP63-high vs. -low ESCC tumors. E Negative correlation between CD8+ T cell fraction and TP63 expression in 76 ESCC (left), 501 LUSC (middle), and 500 HNSC (right) patient samples. The fraction in LUSC and HNSC samples were predicted by TIMER2 using TCGA expression datasets. Pearson Correlation Coefficient was calculated in B and E. The error bands show 95% confidence interval. R: Pearson’s product-moment correlation; P value: two-sided t-test.

