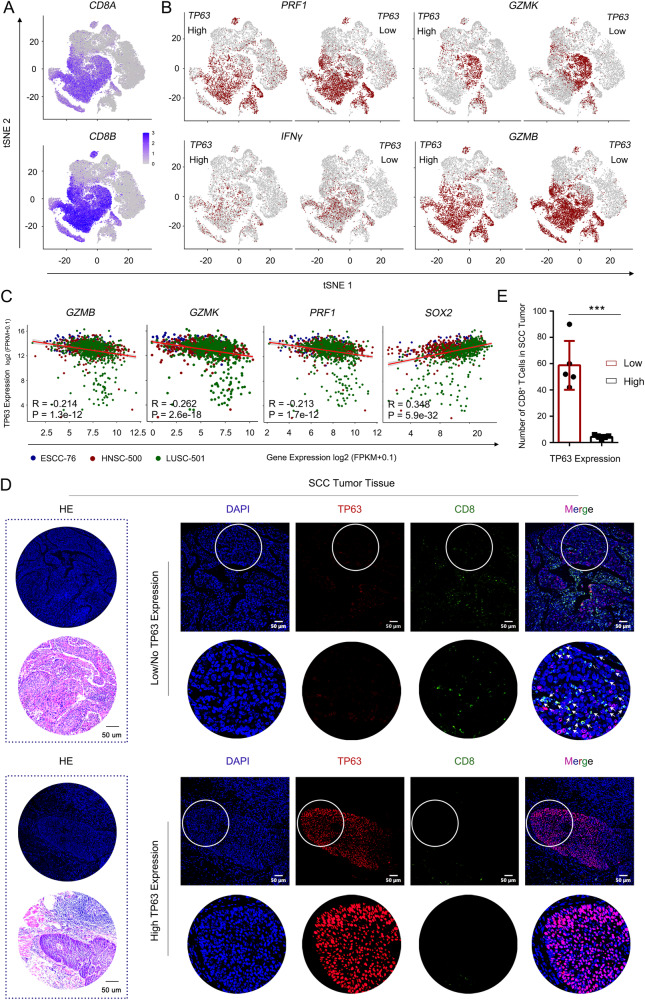
Fig. 4. Over-expression of TP63 impairs CD8+ T cells infiltration and activation.
A, B t-SNE plots showing the expression levels of CD8 (A) and cytotoxic marker genes (B) of CD8+ T cells. Cells with the expression level of cytotoxic marker genes (TPM) high than 1 was labeled. A total of 69,278 T cells from scRNA-seq of 60 ESCC patients (GSE160269) were re-analyzed. TP63 High: 9001 T cells; TP63 Low: 11,012 T cells. C Scatter plots showing the significant negative correlation between cytotoxic marker genes and TP63 expression in three types of SCC patient samples. SOX2 is shown as a positive control. The gene expression was extracted from TCGA bulk RNA-seq. n = 76 (ESCC), 500 (HNSC) and 501 (LUSC) independent patient samples, respectively. Pearson Correlation Coefficient was calculated. R: Pearson’s product-moment correlation; P value: Two-sided t-test. D, E H&E and immunofluorescence (IF) staining of TP63 and CD8 in TP63-high or -low expressing ESCC patient samples. D Representative images. Zoom-in view of the area with white circle as shown below at each right panel. White arrows denote CD8+ cells. E Quantification of infiltrated CD8+ T cells. A total of 10 slides from 10 ESCC patient samples (one slide per patient) were analyzed (TP63-low patients, n = 5; TP63-high patients, n = 5). IF images were acquired at the same exposure time. The staining results were scored by two different researchers according to the fluorescence intensity of TP63; five cases with highest TP63 scores and five with the lowest scores were defined based on the median score. Five fields representing tumor regions were randomly selected for each slide, and the number of CD8+ T cell was counted under ×20 field of view which was then averaged across 5 fields. Statistical analysis was performed by comparing the average CD8+ T cell number of each slide from five TP63-high vs. five TP63-low patients. Data represent mean ± SD. P values were determined using a two-sided t-test. P = 0.0002. ***P < 0.001.

