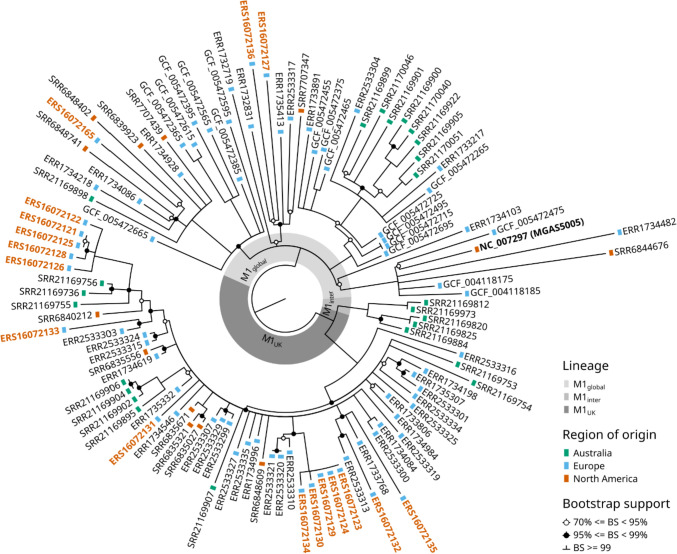
Fig. 2.
Maximum likelihood phylogenetic tree from core SNPs (excluding prophage regions). Isolates are labelled with accession numbers; isolates sequenced for the present study are shown in orange boldface print. M1 lineage is indicated by shading of the inner doughnut plot. Region of strain origin is indicated by coloured rectangles. Nodes with bootstrap support values lower than 70% have been collapsed, and bootstrap support values between 70 and 99% are marked with circles

