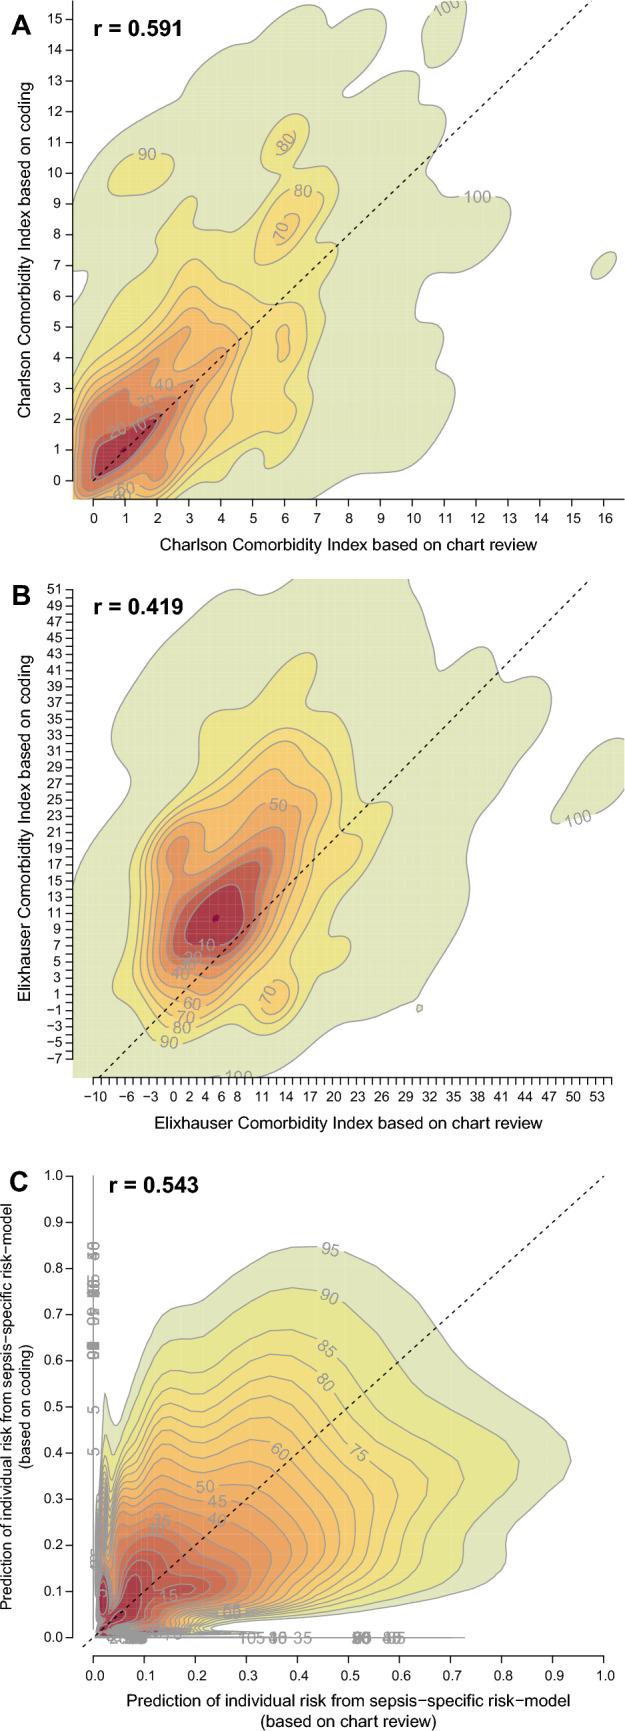
Fig. 2.

Prediction of individual risk of death during the hospital stay comparing information based on administrative health data with information from chart review. Presented are contour plots; r presents the Pearson correlation. Analyses are based on the sample of cases with severe sepsis-1 according to chart review. Figures and correlations are adjusted for sampling weights and clustering. Panel a: contour plot of Charlson Comorbidity Index calculated from comorbidities as identified by chart review (X-axis) compared to information obtained from inpatient administrative health data (IAHD, Y-axis). Panel b: contour plot of Elixhauser Comorbidity Index calculated from comorbidities as identified by chart review (X-axis) compared to information obtained from IAHD (Y-axis). Panel c: contour plot of individual risk of death predicted from the sepsis-specific risk model 1 including risk factors identified by chart review (X-axis) and from the model 2 including risk factors identified from IAHD (Y-axis)
