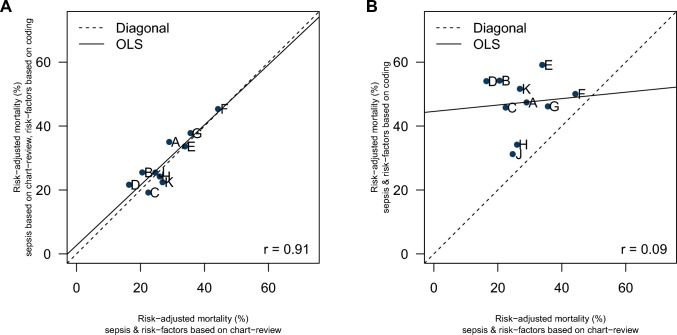
Fig. 3.
Risk-adjusted hospital mortality of patients with severe sepsis-1 comparing information from coding in administrative health data with information from chart review. All estimates of risk-adjusted mortality (dots) are adjusted for sampling weights and clustering. Individual hospitals are represented by capital letters. Panel a: scatterplot of risk-standardized mortality rates (RSMRs) calculated from a model based on cases with severe sepsis-1 as well as risk factors identified in chart review (reference model 1, X-axis) and RSMRs calculated from a model based on cases with severe sepsis-1 identified in chart review but risk factors identified by coding in inpatient administrative health data (model 2, Y-axis). Panel b: scatterplot of RSMRs calculated from a model based on cases with severe sepsis-1 as well as risk factors identified in chart review (reference model 1, X-axis) and RSMRs calculated from a model completely based on coding in inpatient administrative health data (identification of cases with severe sepsis-1 as well as risk factors, model 3, Y-axis)

