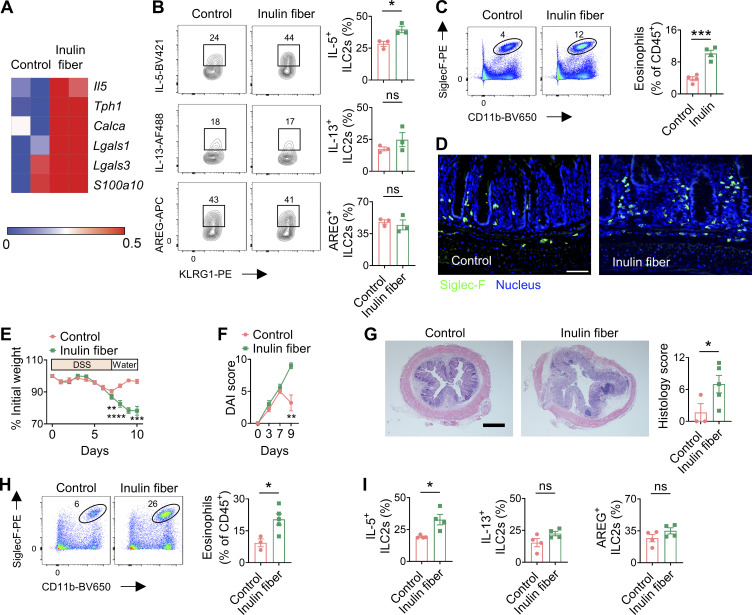
Figure 1.
Inulin fiber diet activates ILC2INFLAM and exacerbates intestinal damage and inflammation. (A) Heatmap showing differential gene expression of colonic ILC2s in mice fed the control or inulin fiber diet for 2 wk (n = 2 mice). (B) Frequency of IL-5–expressing, IL-13–expressing, or AREG-expressing KLRG1+ ILC2s in colonic lamina propria, determined by intracellular cytokine staining (n = 3 mice). Flow cytometry plots were gated from CD45+Lin−CD90.2+CD127+ cells. (C) Representative flow cytometry plots and frequency of CD11b+SiglecF+ eosinophils in the CD45+ population (n = 4 mice). (D) Representative immunofluorescence staining showing Siglec-F+ eosinophils in the colons. Scale bar = 50 μm. (E and F) Disease and recovery of DSS-treated control diet– and inulin fiber diet–fed mice were monitored by daily weight loss (E) and DAI (F). Mice were fed control or inulin fiber diet from 2 wk prior to the DSS challenge to the endpoint of the experiment (n = 5 mice). (G) Representative H&E staining of distal colons at the endpoint of the DSS experiment. Scale bar = 500 μm. Graph shows histological scores (n = 3–5 mice). (H) Representative flow cytometry plots and frequency of CD11b+SiglecF+ eosinophils in the CD45+ population (n = 3–5 mice). (I) Frequency of IL-5–expressing, IL-13–expressing, or AREG-expressing KLRG1+ ILC2s in colonic lamina propria, determined by intracellular cytokine staining (n = 4 mice). Data are representative of three (C and E–G) or two (B, D, H, and I) independent experiments. Data are means ± SEM. Statistics were calculated by unpaired two-tailed t test. *P < 0.05, **P < 0.01, ***P < 0.001, ****P < 0.0001, ns, not significant.

