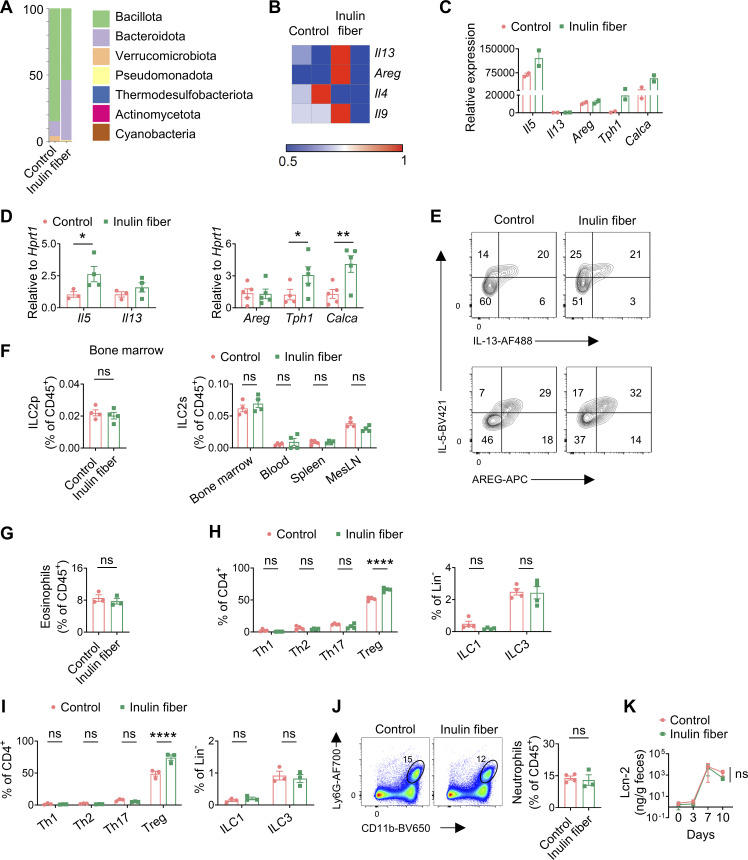
Figure S1.
Microbial and immunological parameters in mice upon exposure to inulin fiber diet and DSS. (A) Representative taxonomic classification of 16S rRNA genes in fecal suspension from mice fed with control or inulin fiber diet for 2 wk. (B) Heatmap showing gene expression of colonic ILC2s in mice fed the control or inulin fiber diet (n = 2 mice). (C) Expression levels of various genes determined by RNA-seq of sorted ILC2s (n = 2 mice). (D) Expression levels of various genes determined by RT-qPCR of sorted ILC2s (n = 3–5 mice). (E) Representative flow cytometry plots showing co-expression of IL-5 and IL-13 (top panels) and IL-5 and AREG (bottom panels) in the colonic ILC2s. (F) Frequency of ILC2 progenitor cells (ILC2p) in the bone marrow and ILC2s in various tissues of mice fed with control or inulin fiber diet for 2 wk (n = 4 mice). (G) Frequency of colonic eosinophils in mice fed with control or inulin fiber diet for 2 wk and then regular chow for 4 wk (n = 3 mice). (H) Frequency of various T cells and ILCs in the colons of mice fed with control or inulin fiber diet for 2 wk (n = 4 mice). (I) Frequency of various T cells and ILCs in the colons of mice at the endpoint after DSS treatment (n = 3 mice). (J) Representative flow cytometry plots and frequency of CD11b+Ly6G+ neutrophils in colons of mice treated with DSS (n = 3–4 mice). (K) Levels of fecal lipocalin-2 (Lcn-2) in DSS-treated mice measured by ELISA (n = 5 mice). Data are representative of two independent experiments (A and D–K). Data are means ± SEM. Statistics were calculated by unpaired two-tailed t test (F, G, J, and K) or two-way ANOVA with uncorrected Fisher’s LSD test (D, H, and I). *P < 0.05, **P < 0.01, ****P < 0.0001, ns, not significant.

