Figure 1.
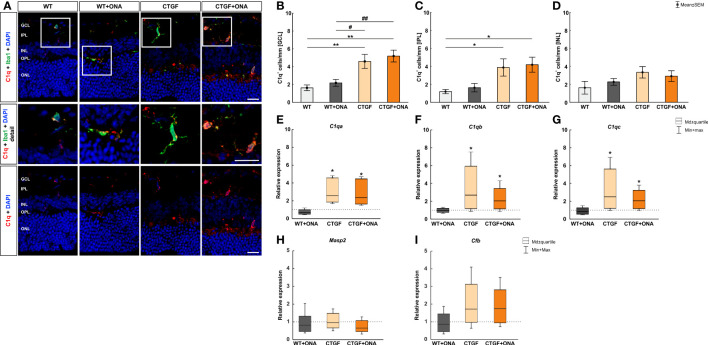
Elevated classical pathway in high-pressure animals. (A) Retinal cross-sections were labelled with an antibody against C1q (classical complement pathway; red) and cell nuclei were stained with DAPI (blue). An antibody against Iba1 (microglia/macrophages; green) was utilized to evaluate co-staining of C1q and Iba1. In the detailed images, it could be shown that many C1q+ cells are also positive for Iba1. (B) The number of C1q+ cells in the GCL was comparable in WT+ONA and WT animals. Contrary, significantly more C1q+ cells were noted in CTGF (p=0.007) and CTGF+ONA retinae (p=0.001) compared to WT ones. Also, this number was higher in CTGF (p=0.032) and CTGF+ONA mice (p=0.006) when compared to WT+ONA animals. (C) In the IPL, the number of C1q+ cells was similar in WT+ONA and WT mice. More C1q+ cells could be noted in CTGF(p=0.049) and CTGF+ONA retinae (p=0.025) compared to WT animals. (D) The number of C1q+ cells in the INL was comparable within all groups. (E) The mRNA expression of C1qa was not altered in WT+ONA mice. A significant upregulation of C1qa mRNA levels was observed in CTGF (p=0.039) and CTGF+ONA retinae (p=0.039). (F) The C1qb mRNA expression level did not differ in WT+ONA retinae compared to WT. In CTGF mice, a significant upregulated C1qb mRNA level was observed (p=0.035). Also, C1qb levels were elevated in CTGF+ONA mice (p=0.046). (G) While no alterations were revealed in the mRNA expression levels of C1qc in WT+ONA retinae, a significant upregulation was observable in CTGF (p=0.033) and CTGF+ONA mice (p=0.046). (H) Moreover, the Masp2 mRNA levels, as part of the lectin pathway, were analyzed. Here, the Masp2 expression was comparable in all glaucoma groups compared to WT retinae. (I) Also, the mRNA levels of the alternative pathway component Cfb were not altered within the groups. GCL, ganglion cell layer; IPL, inner plexiform layer; INL, inner nuclear layer; OPL, outer plexiform layer; ONL, outer nuclear layer. Values in (B–D) are mean ± SEM and in (E–I) median ± quartile ± minimum/maximum. The dotted lines in (E–I) represent the relative expression of the WT group. Scale bars: 20 µm; scale bar in detailed images: 10 µm. For immunohistology: n=7 retinae/group, for RT-qPCR: n=4 samples/group. *p<0.050 and **p<0.010 vs. WT; #p<0.050 and ##p<0.010 vs. WT+ONA.

