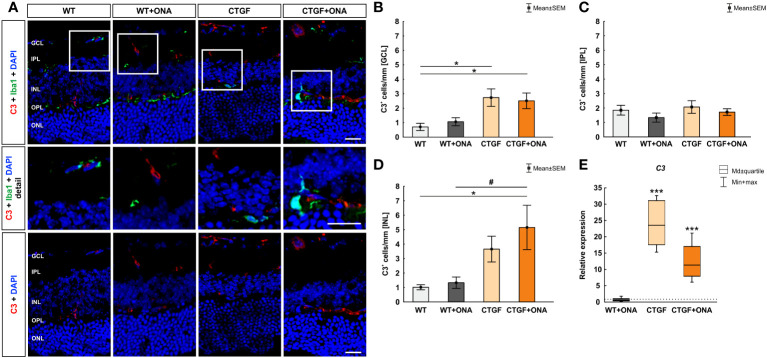
Figure 2.
Increase of terminal complement pathway components. (A) An anti-C3 antibody (terminal complement pathway) was used to label retinal cross-sections (red), while DAPI counterstained cell nuclei (blue). An antibody against Iba1 (microglia/macrophages; green) was utilized to show co-staining of C3 and Iba1. Herein, most C3 cells were not positive for Iba1+ microglia (detailed images). (B) The number of C3+ cells in the GCL was comparable in WT+ONA and WT mice. Significantly more C3+ cells were noted in CTGF (p=0.018) and CTGF+ONA mice (p=0.039) compared to WT ones. (C) The cell counts of C3 in the IPL were comparable in all groups. (D) In the INL, the number of C3+ cells did not differ between WT+ONA and CTGF mice compared to WT ones. A higher number of C3+ cells was noted in CTGF+ONA retinae compared to WT (p=0.019) and WT+ONA mice (p=0.032). (E) No alterations were measured in C3 mRNA expression levels in WT+ONA animals. In CTGF as well as in CTGF+ONA mice, a significant upregulation of C3 mRNA levels could be observed (both: p<0.001). GCL, ganglion cell layer; IPL, inner plexiform layer; INL, inner nuclear layer; OPL, outer plexiform layer; ONL, outer nuclear layer. Values in (B–D) are mean ± SEM and in (E) median ± quartile ± minimum/maximum. The dotted line in (E) represents the relative expression of the WT group. Scale bars: 20 µm, scale bar in detailed images: 10 µm. For immunohistology: n=7 retinae/group, for RT-qPCR: n=4 samples/group. *p<0.050 and ***p<0.001 vs. WT; #p<0.050 vs. WT+ONA.

