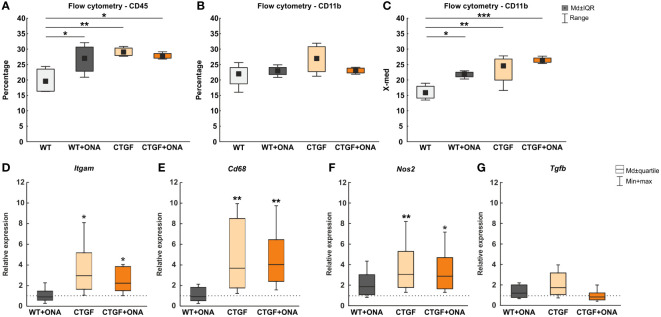
Figure 4.
Enhanced microglia and macrophage markers in CTGF and CTGF+ONA animals. (A) Significantly more CD45+ cells were observed in WT+ONA (p=0.036), CTGF (p=0.006), and CTGF+ONA mice (p=0.016) compared to WT. (B) Further, the percentage of CD11b+ microglia cells was determined using flow cytometry. Here, no changes could be observed within all groups. (C) In addition, the fluorescent intensity of CD11b was measured. Here, a significantly higher intensity was detected in WT+ONA (p=0.036), CTGF (p=0.008) and CTGF+ONA retinae (p<0.001) when compared to WT ones. (D) The Itgam (CD11b) mRNA expression levels were unchanged in WT+ONA retinae. However, a significant upregulation was measured in CTGF (p=0.027) as well as in CTGF+ONA samples (p=0.042). (E) While no alterations could be revealed regarding Cd68 mRNA expression levels in WT+ONA mice, significantly upregulated expression levels were noted in both CTGF and CTGF+ONA retinae (both: p=0.009). (F) No changes were observed in Nos2 mRNA expression levels in WT+ONA mice. The Nos2 mRNA expression levels were significantly upregulated in CTGF (p=0.008) and CTGF+ONA animals (p=0.023). (G) The mRNA expression of Tgfb was comparable to the WT situation in all groups. Values in (A–C) are median ± interquartile range ± range and in (D–G) median ± quartile ± minimum/maximum. The dotted lines in (D–G) represent the relative expression of the WT group. n=4 samples/group. *p<0.050, **p<0.010, and ***p<0.001 vs. WT.

