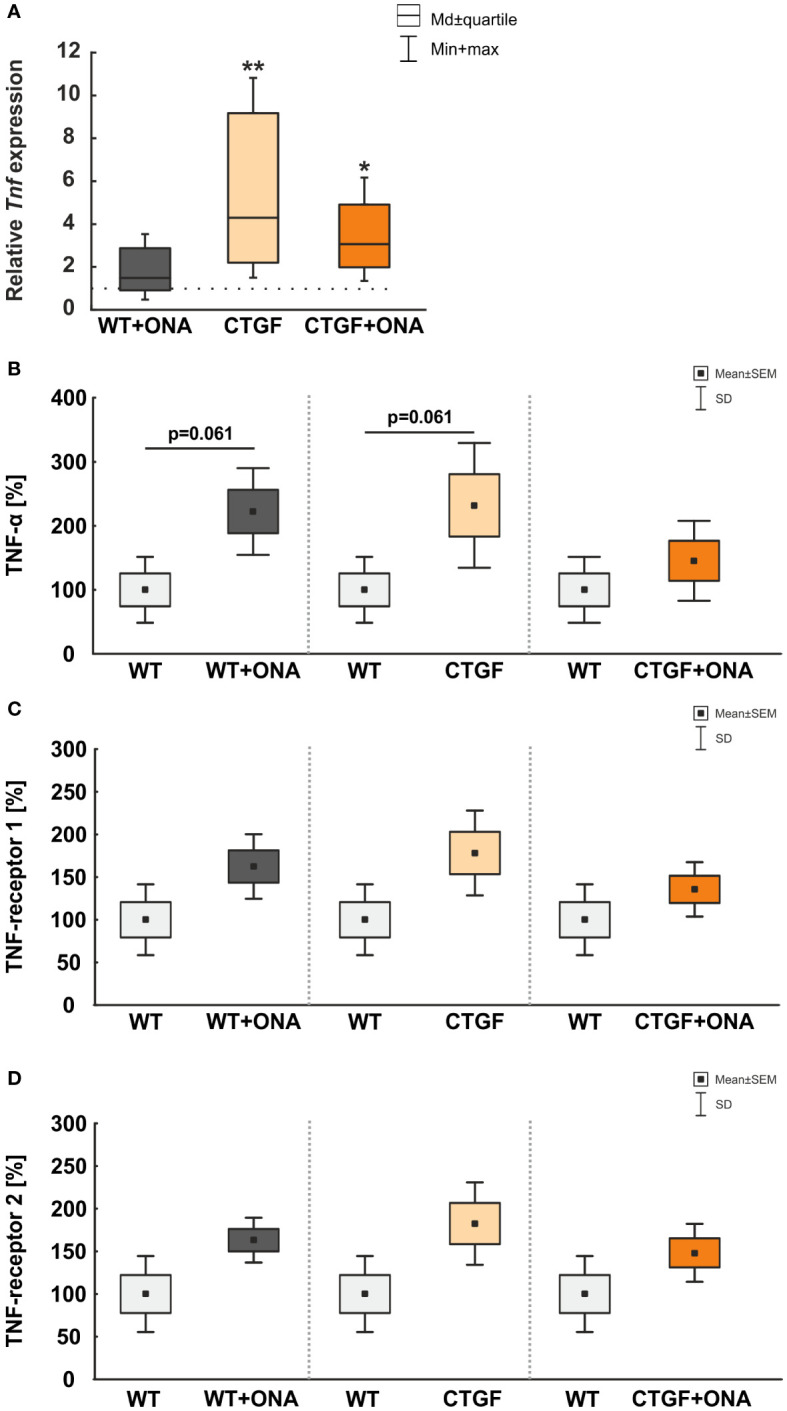
Figure 5.

Elevated TNF-α levels. (A) The mRNA expression level of Tnf was not altered in WT+ONA mice. A significant Tnf upregulation was noted in CTGF (p=0.006) and CTGF+ONA retinae (p=0.026). (B) The microarray serum analyses showed no significant changes for TNFα in all groups. (C) The serum levels of TNF-receptor 1 were not significantly altered in WT+ONA and CTGF mice in comparison to WT samples. Also, the CTGF+ONA mice displayed no alterations in the serum TNF-receptor 1 levels. (D) The serum levels of TNF-receptor 2 were not altered in all glaucoma groups compared to WT controls. Values in (A) are median ± quartile ± minimum/maximum and in (B–D) mean ± SD ± SEM. The dotted line in (A) represents the relative expression of the WT group. n=4 samples/group. *p<0.050 and **p<0.010 vs. WT.
