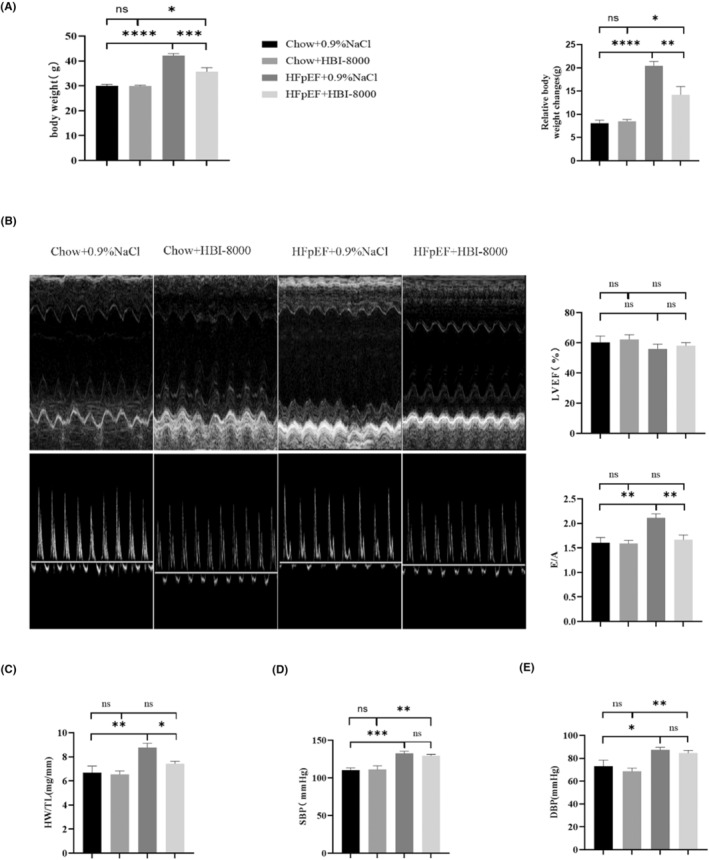
FIGURE 3.

Results of functional index detection after 4 weeks of HBI‐8000 treatment. (A) Body weight levels of mice and relative body weight changes in each group after 4 weeks of drug intervention. (B) Characteristic M‐mode images and pulse‐wave images as well as LVEF and E/A statistics of mice in each group after 4 weeks of HBI‐8000 treatment. (C) Heart weight/tibia length (HW/TL) statistics of mice in each group after 4 weeks of drug intervention. (D, E) Blood pressure levels in the tail artery of mice in each group after 4 weeks of drug intervention. *p < 0.05, **p < 0.01, ***p < 0.001, ****p < 0.0001.
