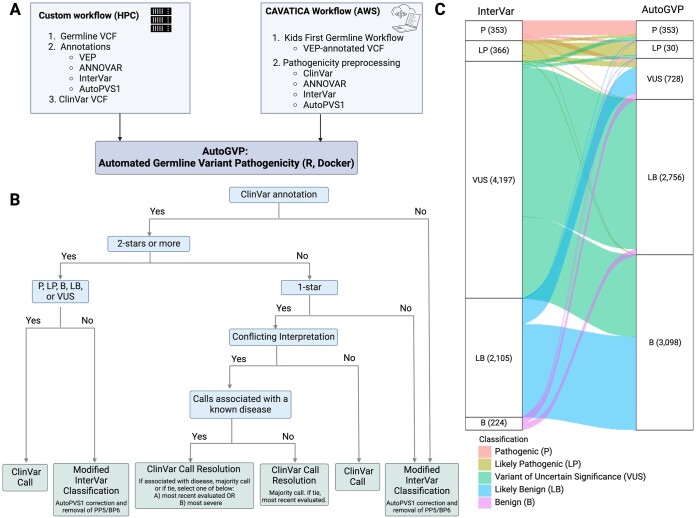
Figure 1.
Flow diagram of AutoGVP. (A) Required input files for custom or CAVATICA workflow. (B) Variant classification method decision tree. (C) Alluvial plot showing how InterVar classification changes in AutoGVP. The large numbers of concordant VUS (357 656), LB (20 374), and B (28 310) variants were removed for easier visualization. Numbers in parentheses represent the number of variants in that classification. Panels (A) and (B) created with BioRender.com.

