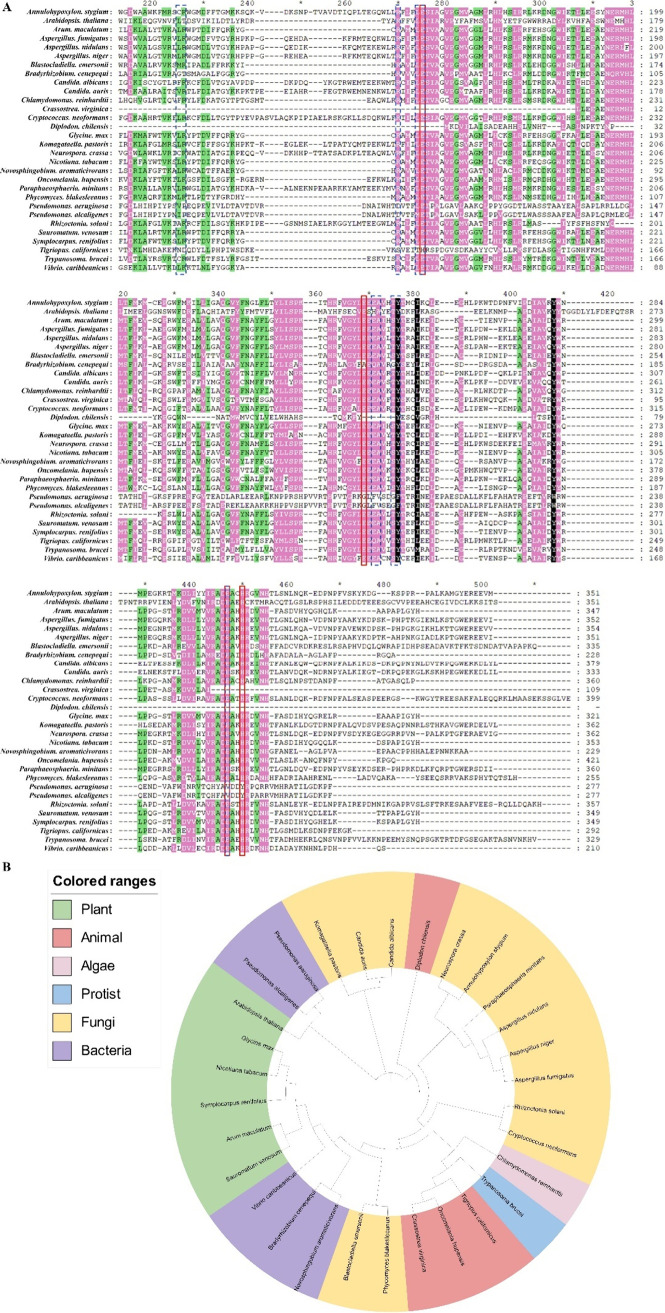
Figure 4.
Protein analyses of AOX. (A) Comparison of protein sequences of AOX in different species mentioned in the text. The protein sequences are sourced from the National Center for Biotechnology Information (NCBI) website. White background, conserved percent is less than (<) 60%; green background, conserved percent is more than (≥) 60% and less than (<) 80%; pink background, conserved percent is more than (≥) 80% and less than (<) 100%; black background, conserved percent is (=) 100%; red solid box, amino acids of di-iron center in TAO (shown in Figure 3B); blue dotted box, amino acids of the conserved binding site of TAO (shown in Figure 7K). (B) The evolutionary tree of AOX in different species mentioned in the text.

