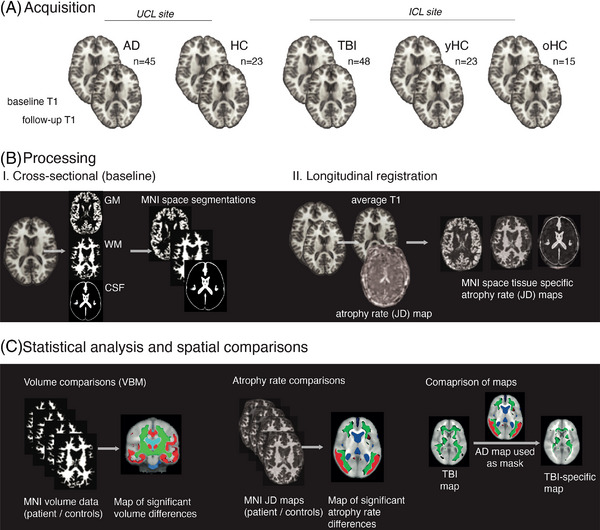
FIGURE 1.

Neuroimaging methods. (A) Serial volumetric T1‐weighted MRIs were acquired in (Alzheimer's disease) AD and age‐matched healthy controls (HCs) at University College London; patients after a single moderate to severe traumatic brain injury (TBI), young TBI age‐matched HCs (yHC), and older HCs (oHC, matched to the AD group) at ICL. (B) Images were processed using SPM12 with segmentation and nonlinear registration to MNI standard space. Images were modulated to preserve volume information. Longitudinal registration of scan pairs generated temporal average space T1 maps and Jacobian determinant (JD) rate maps of atrophy rates per subject. The JD map was multiplied by the segmented temporal average image and registered (nonlinearly) to MNI space. (C) MNI space images were used in permutation testing (FSL) to assess for voxelwise differences in baseline volume or atrophy rate, in different tissue classes. Subtractive analyses, using p‐statistic images outputted from other disease entities, show disease‐specific or shared patterns of progressive atrophy.
