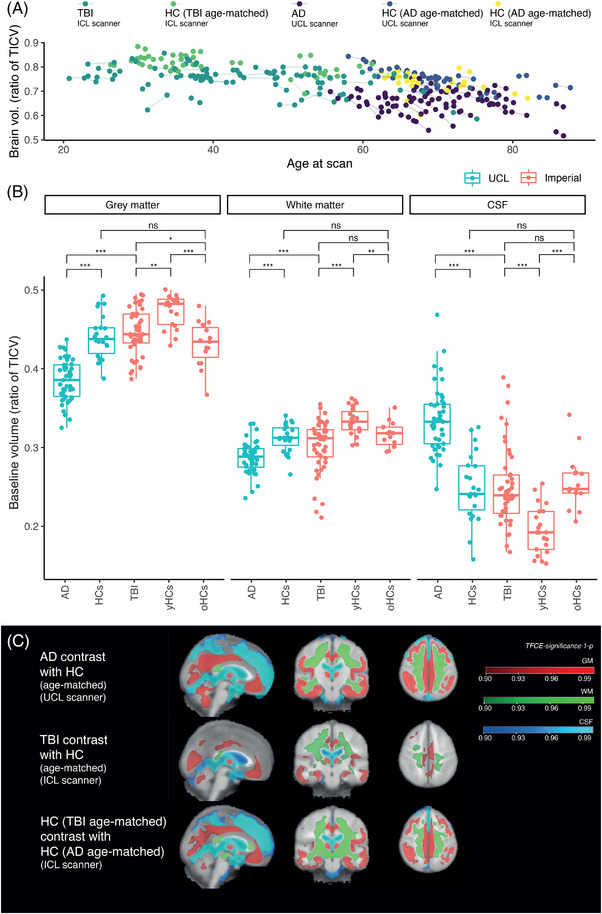
FIGURE 2.

Brain volumes and baseline atrophy patterns. (A) Normalized (divided by total intracranial volume [TICV]) whole‐brain volumes (defined as white plus gray matter volume) related to age at MRI scanning and participant group. (B) Brain volumes across different groups normalized by TICV. Comparisons are between AD and HCs at UCL; AD and TBI; TBI and ICL young healthy controls (yHCs); TBI and ICL older healthy controls (oHCs); yHCs and oHCs; HCs at UCL and oHCs at ICL. Wilcox tests performed; p values are false discovery rate (FDR) corrected for multiple comparisons. *p < 0.05; **p < 0.01; ***p < 0.001. (C) Voxelwise contrasts (threshold‐free cluster enhancement corrected p value significance maps) demonstrate patterns significant for gray matter (red) and white matter (green) atrophy and cerebrospinal fluid expansion (blue).
