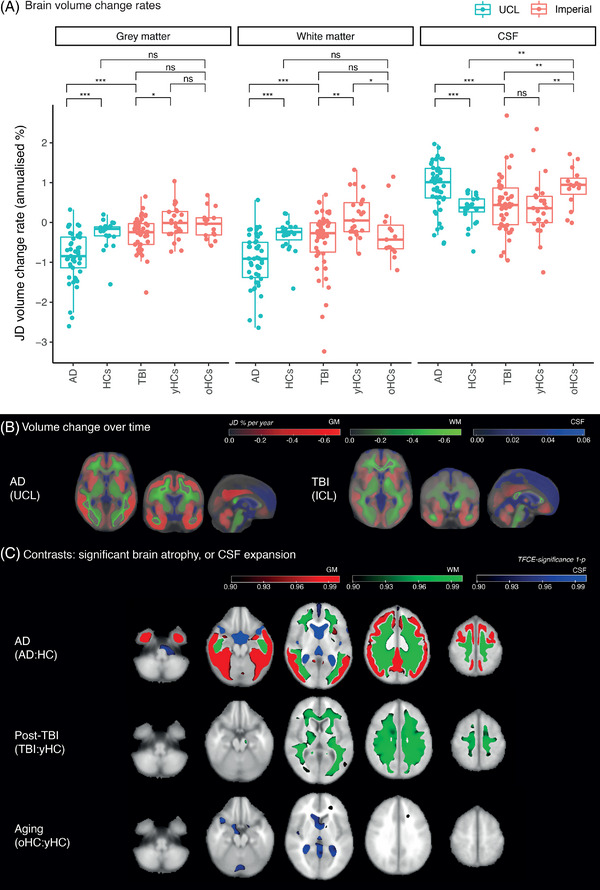
FIGURE 3.

Longitudinal patterns of brain volume change in Alzheimer's disease and after traumatic brain injury. (A) JD (Jacobian determinant) volume change rates in different tissue classes. Negative values: contraction; positive: expansion; HC: healthy control. (B) Group average JD maps showing atrophy rates in gray matter (red) or white matter (green) and cerebrospinal fluid (CSF) expansion (blue). (C) Voxelwise contrasts of JD rate maps. Regions with significantly greater longitudinal atrophy rates are shown in red for gray matter and green for white matter, and those with significant expansion in CSF are in blue.
