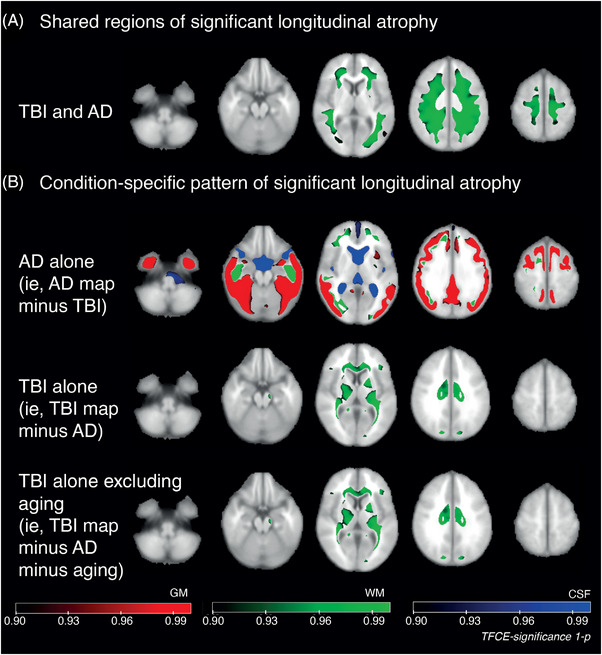
FIGURE 4.

Comparisons of atrophy rates across Alzheimer's disease (AD) and traumatic brain injury (TBI). (A) Composite map showing shared regional significant volume change over time in TBI and AD. (B) Composite maps of shared significant volume change over time: top map—regions of significant change found only in AD but not in TBI; middle map—regions significant in TBI only; lower map—as per middle, but with regions significantly changing in aging also excluded.
