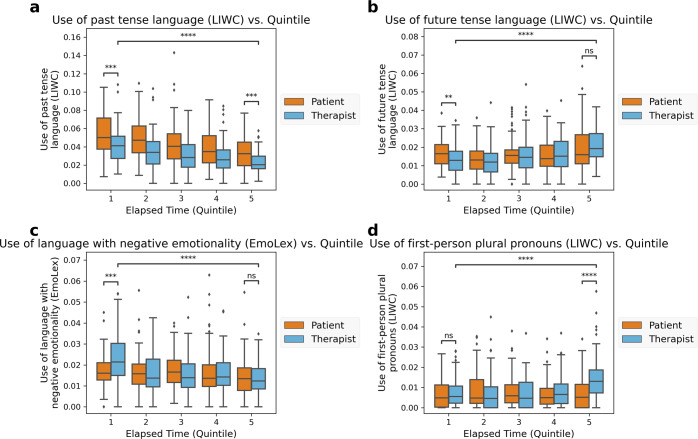
Fig. 2. Therapist and patient language within-session changes.
Quantitative assessment of changes in therapist language features over time, as well as within-quintile differences between patient and therapist language. b and c show examples of patient and therapist language features that converged over time. d illustrates a case where patient and therapist language features diverged over time. a highlights a language feature that was significantly different between therapist and patient and neither converged nor diverged over the course of the session. The center line of each boxplot shows the median value for that time bin, while the lower and upper bounds of the box indicate the first quartile (25th percentile) and third quartile (75th percentile), respectively. The lower and upper “whiskers” extend to 1.5x the interquartile range (IQR) beyond the lower and upper quartile, respectively. Observations outside this range are displayed as independent points. All differences annotated with asterisks (*) are significant at level α = 0.05 after controlling for multiple hypothesis tests via the Benjamini-Hochberg procedure. p-value annotation: Non-significant (ns): 0.01 < p ≤ 1.0; *0.01 < p ≤ 0.05; **0.001 < p ≤ 0.01; ***0.0001 < p ≤ 0.001; ****p ≤ 0.0001.

