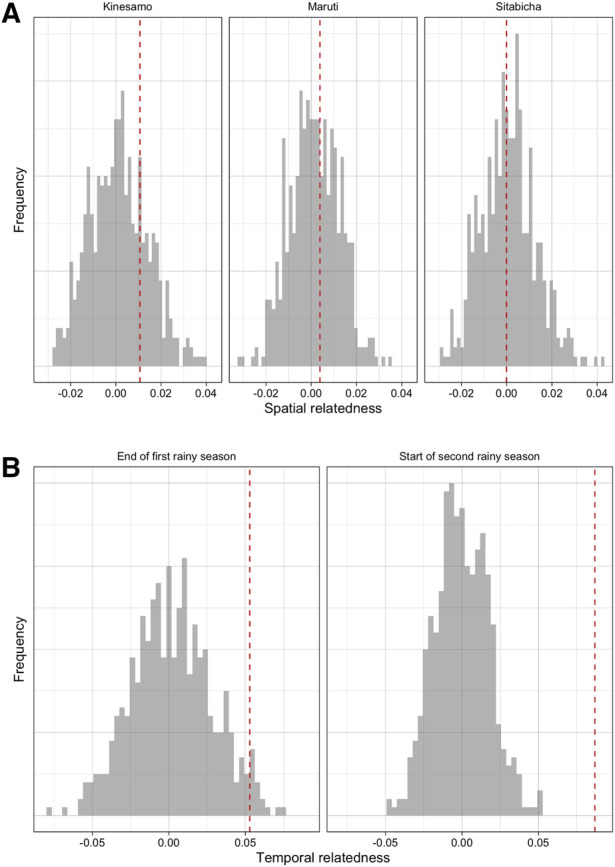
Figure 2.

The overall patterns of differentiation across space and time amongst samples from the cohort data. (A) Spatial relatedness in cohort data in each village (difference in mean relatedness in pairs of infections where both are from the specified village and pairs where only one is from that village). (B) Temporal relatedness (difference in mean relatedness in pairs of infections where both are from the same time period and pairs from different time periods) when considering the end of the first rainy season and start of the second rainy season. In both panels, the value observed in the data (red dashed line) is compared to a null distribution where there is no village or temporal structure, respectively (grey histogram).
