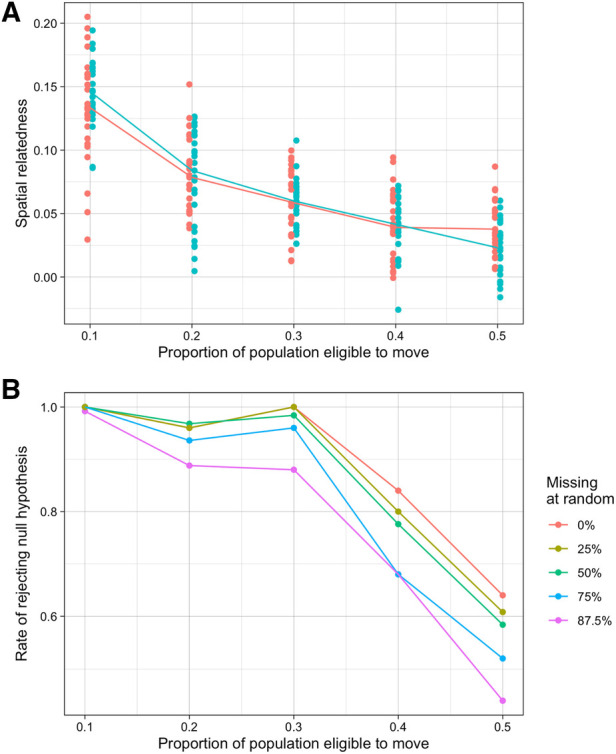
Figure 3.

Simulated results of spatial relatedness under various mobility and missingness conditions. (A) Spatial relatedness across multiple simulations and different proportions of the population moving between locations. Values for each location are shown in different colours and the median is shown by the line. (B) Rate that the null hypothesis of no location relatedness structure was rejected at different proportions of random missingness.
