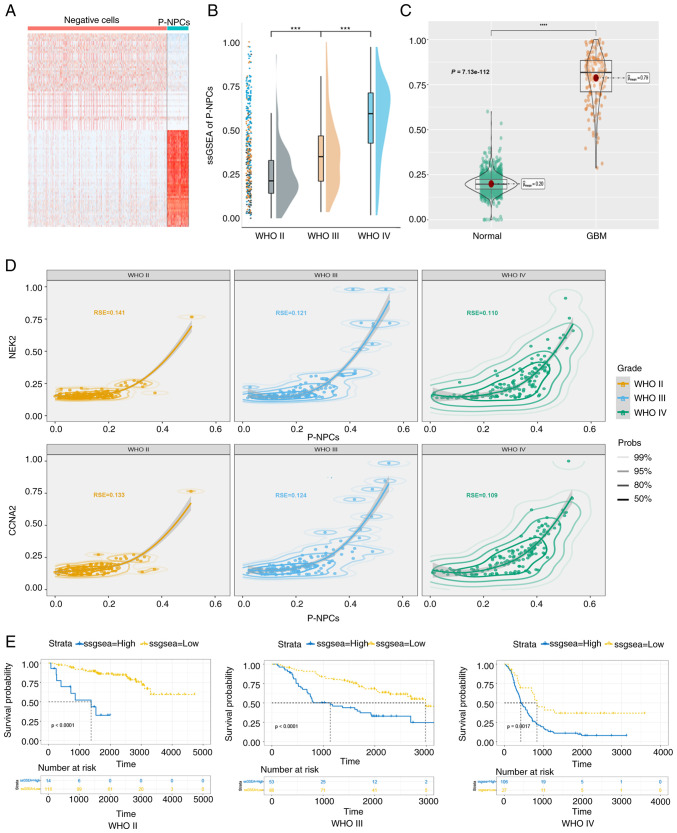
Figure 5.
GBM prognosis may be associated with P-NPCs. (A) Heatmap of gene expression differences between negative-cells and P-NPCs. (B) ssGSEA score of P-NPCs in the Chinese Glioma Genome Atlas database across various grades of glioma (***P<0.001, with independent t-test). (C) The ssGSEA score of P-NPCs derived from both normal and GBM patient samples in The Cancer Genome Atlas database (****P<0.0001, with independent t-test). (D) Suitability of P-NPCs and CCNA2 and NEK2 expression in glioma grades. (E) Association of high expression of marker genes with shorter overall survival in patients with glioma, according to the Kaplan-Meier analysis (P<0.0001 for WHO II, P<0.0001 for WHO III and P=0.0017 for WHO IV, respectively, with log-rank test). GBM, glioblastoma; P-NPCs; positive neural progenitor cells; ssGSEA, single-sample gene set enrichment analysis; CCNA2, cyclin A2; NEK2, NIMA related kinase 2; WHO, World Health Organization.

