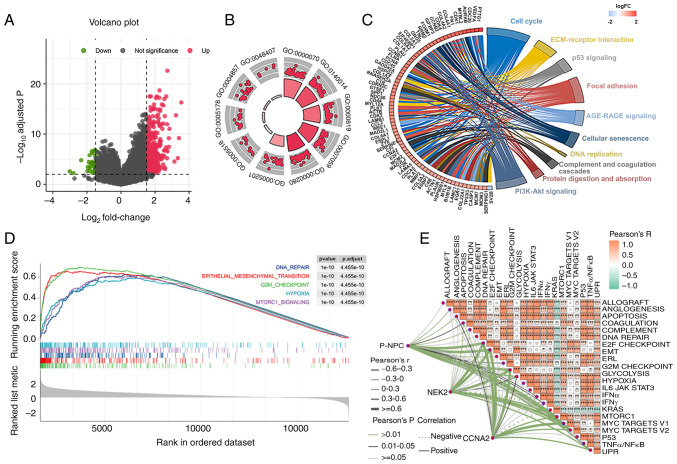
Figure 6.
P-NPCs are associated with the co-expression of CCNA2 and NEK2 in the G2M checkpoint pathway. (A) Identification of upregulated genes in patients with GBM with different prognoses in a volcano plot, based on log2FC >1.5 and an adjusted P-value <0.05. (B) Gene Ontology analysis of DEGs. (C) The Kyoto Encyclopedia of Genes and Genome analysis of DEGs. (D) The GSEA analysis revealed five pathways significantly activated in patients with poor survival. (E) A correlation was found between the single-sample GSEA score of P-NPCs and the expression of CCNA2 and NEK2 in the G2M checkpoint pathway (*P<0.05, **P<0.01 and ***P<0.001, with independent t-test). CCNA2, cyclin A2; NEK2, NIMA related kinase 2; GBM, glioblastoma; DEGs, differentially expressed genes; GSEA, gene set enrichment analysis; P-NPC, positive neural progenitor cell.

