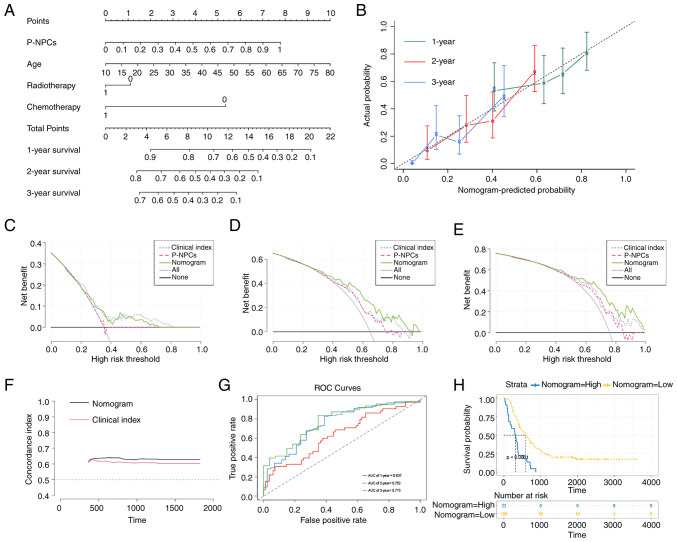
Figure 8.
Establishment and evaluation of a nomogram with TCGA dataset. (A) A nomogram predicts 1-, 2- and 3-year overall survival probability in GBM by considering P-NPCs, age, chemotherapy and radiotherapy scores. (B) The calibration curves for 1, 2 and 3 years showed improved calibration potential in TCGA cohort. The black dotted lines represent the ideal predictive model, whereas the solid lines represent the nomogram models for each respective year. (C-E) The decision curve analysis was used to evaluate the clinical application of the nomogram and the net benefit of various prediction models when the threshold probability is between 0 and 0.80. (F) The concordance index was used to evaluate the accuracy and discrimination of the nomogram's predicted values vs. the clinical index model. (G) Time-dependent ROC curve analysis was conducted for the nomogram at 1, 2 and 3 years in TCGA cohort. (H) The Kaplan-Meier analysis found that higher nomogram scores were linked to poorer prognosis in patients with GBM (P<0.0001 with log-rank test). TCGA, The Cancer Genome Atlas; GBM, glioblastoma; P-NPCs, positive neural progenitor cells; ROC, receiver operating characteristic.

