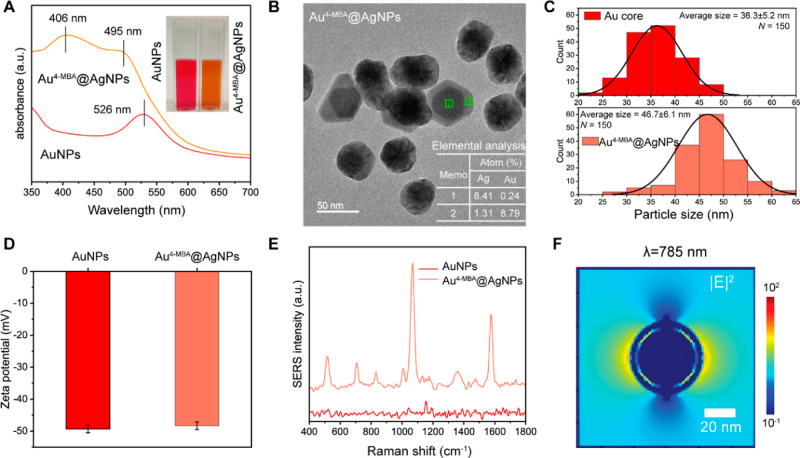
Figure 2.
Characterization of AuNPs and core–shell Au4-MBA@AgNPs. (A) UV–visible spectra. (B) TEM image of the core–shell Au4-MBA@AgNPs. The table shows the EDS elemental analysis from core (rectangle 2) and shell (rectangle 1). (C) Analysis of the average particle sizes of the Au core and the Au4-MBA@AgNPs, calculated from TEM images (N = 150). (D) Zeta potential measurements. (E) Comparative SERS spectra of 4-MBA-functionalized AuNPs and core–shell Au4-MBA@AgNPs. (F) FDTD-calculated electric field intensity |E|2 distribution map at 785 nm.

