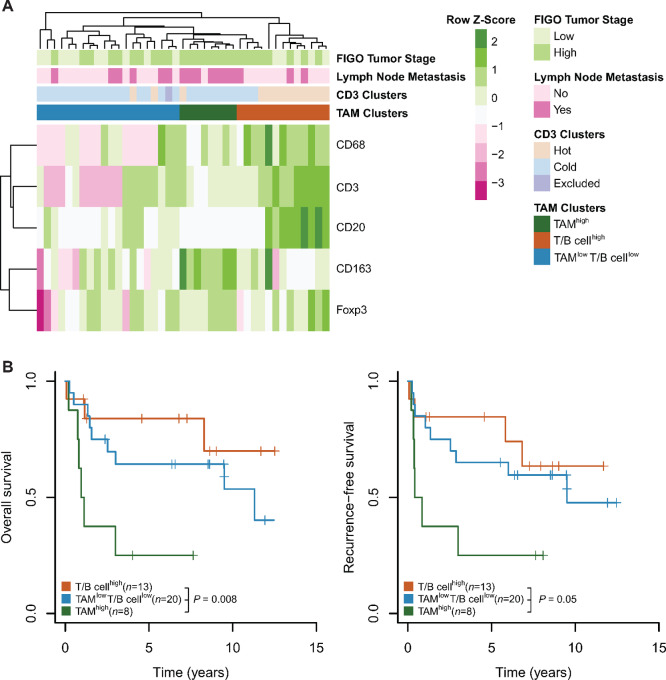
FIGURE 2.
The TAMhigh immune cell cluster is associated with poor outcome. A, Heat map shows the distribution of immune cells (intratumoral and stromal combined). Immunoreactivity was recorded as in Fig. 1B. Unsupervised clustering of log2-transformed cell count data from 41 samples was performed using Euclidean distance. B, Kaplan–Meier plots depict OS and RFS of patients stratified by TAM clusters from A; significance analysis by log-rank test.

