FIGURE 6.
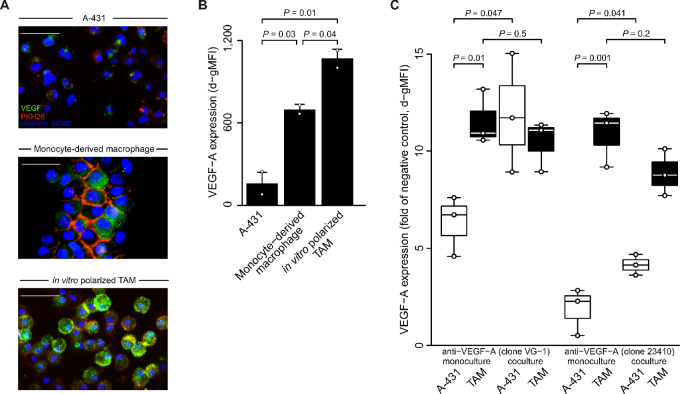
VEGF-A expression by in vitro polarized TAMs. A, Healthy donor monocytes were differentiated into macrophages using GMCSF and exposed to different culture conditions: medium alone (monocyte-derived macrophage) or A-431 supernatant (in vitro polarized TAM). Immunofluorescent staining was performed on day 5 and compared with A-431 cells. Cells were stained with anti-VEGF-A (clone VG-1; cytoplasma, green), PKH26 (cell membrane, red), and Hoechst 34580 (cell nucleus, blue). Representative overlay figures are depicted (32x magnification); white scale bar length 200 µm. B, Macrophages were generated as in A and intracellular VEGF-A expression was determined by flow cytometry (anti-VEGF-A clone 23410) on day 5. Data combine results from two independently analyzed individuals. Data are given as d-gMFIs. Individual datapoints, shown as dots, overlap summary statistics barplots (mean ± SEM). Significance analysis by two-sided Student t test. C, Macrophages were generated as in A, and in vitro polarized TAMs and A-431 cells were cultured alone (monoculture) or together (coculture with 2:1 ratio) in the presence of LPS. Intracellular VEGF-A expression was determined by flow cytometry using two anti-VEGF-A antibody clones as indicated after 24 hours of coculture following a 4-hour restimulation with Brefeldin A. For comparison between different cell types, specific cell populations of interest were identified on the basis of their expression of phenotypic markers (EpCAM for cancer cells, CD14 for macrophages), a negative control was included, and cocultured cells were normalized to VEGF expression of blood lymphocytes. Data combine results from three individuals and are given as d-gMFIs. Individual datapoints, shown as dots, overlap summary statistics boxplots with medians represented by horizontal center lines. Significance analysis by two-sided Student t test.

