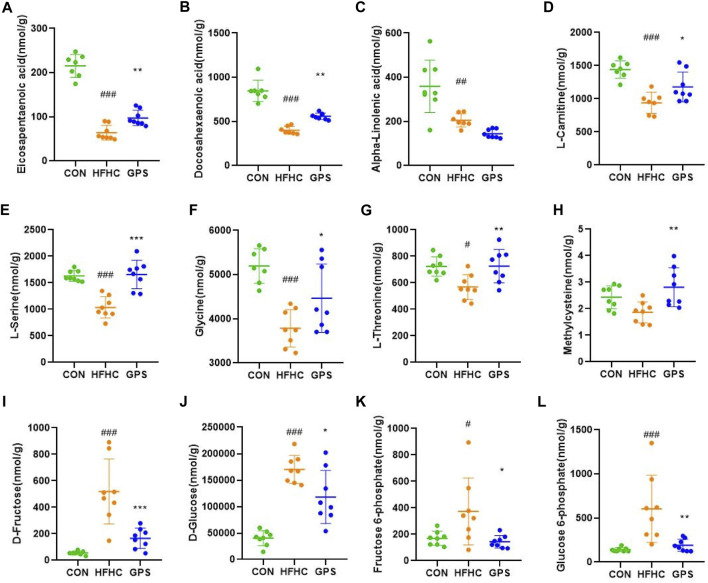
FIGURE 4.
Targeted metabolomic analysis (n = 7-8 per group). (A) eicosapentaenoic acid. (B) docosahexaenoic Acid. (C) α-Linolenic acid. (D) L-carnitine. (E) L-serine. (F) glycine. (G) L-threonine. (H) Methylcysteine. (I) D-Fructose. (J) D-Glucose. (K) Fructose 6-phosphate. (L) Glucose 6-phosphate. Results were presented as means ± SD. #p < 0.05, ##p < 0.01 and ###p < 0.001 compared with the control group, and *p < 0.05, **p < 0.01 and ***p < 0.001 compared with the HFHC group.

