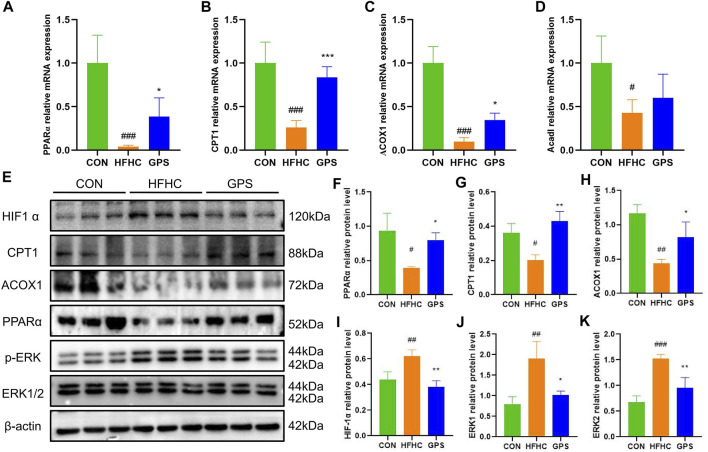
FIGURE 5.
GPS enhanced the PPARα signaling pathway and inhibited the HIF-1α signaling pathway in mice. (A) The mRNA expression levels of PPARα in liver tissue and β-actin were used to normalize the samples (n = 4-5 per group). (B) The mRNA expression levels of CPT1 in liver tissue and β-actin were used to normalize the samples (n = 4-5 per group). (C) The mRNA expression levels of ACOX1 in liver tissue and β-actin were used to normalize the samples (n = 4-5 per group). (D) The mRNA expression levels of Acadl in liver tissue and β-actin were used to normalize the samples (n = 4-5 per group). (E) Western blot analysis of PPARα, CPT1, ACOX1 HIF-1α, p-ERK/ERK1, and p-ERK/ERK2 in liver tissues (n = 3 per group). (F) Statistical graph of PPARα protein level in liver tissues. (G) Statistical graph of CPT1 protein level in liver tissues. (H) Statistical graph of ACOX1 protein level in liver tissues. (I) Statistical graph of HIF-1α protein level in liver tissues. (J) Statistical graph of p-ERK/ERK1 protein level in liver tissues. (K) Statistical graph of p-ERK/ERK2 protein level in liver tissues. Results were presented as means ± SD. #p < 0.05, ##p < 0.01 and ###p < 0.001 compared with the control group, and *p < 0.05, **p < 0.01 and ***p < 0.001 compared with the HFHC group.

