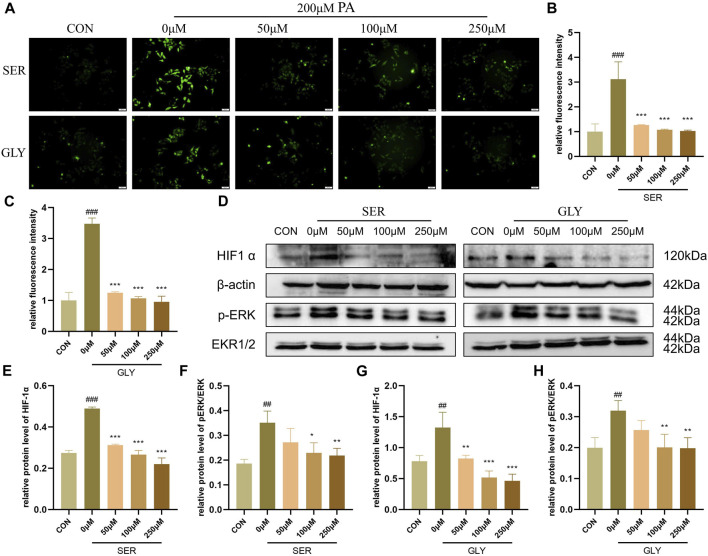
FIGURE 7.
L-serine and glycine regulated HIF1α to inhibit oxidative stress (n = 3 per group). (A) Intracellular ROS level with different concentrations of L-serine and glycine supplementation. (B) Statistical graph of fluorescence intensity after L-serine supplementation. (C) Statistical graph of fluorescence intensity after glycine supplementation. (D) Western blot analysis of HIF1α and phosphorylation level of ERK with different concentrations of L-serine and glycine supplementation. (E) Statistical graph of HIF1α protein level after L-serine supplementation. (F) Statistical graph of phosphorylation level of ERK after L-serine supplementation. (G) Statistical graph of HIF1α protein level after glycine supplementation. (H) Statistical graph of the phosphorylation level of ERK after glycine supplementation. Results are presented as means ± SD. #p < 0.05, ##p < 0.01 and ###p < 0.001 compared with the control group, and *p < 0.05, **p < 0.01 and ***p < 0.001 compared with the HFHC group.

