
FIGURE 5.
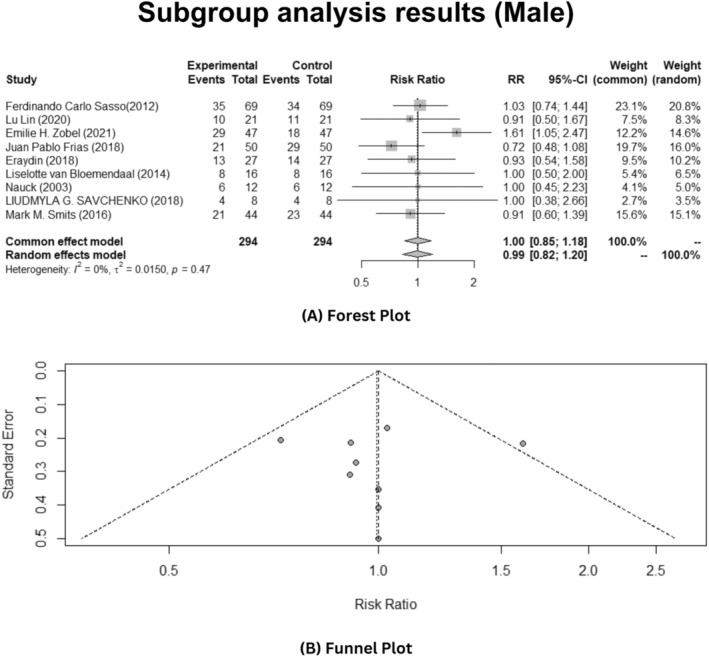
Gender‐specific sub‐group analysis of male patients depicting effects of the GLP‐1 analogues on T2DM patients. (A) Forest plot. (B) Publication bias funnel plot.
Official websites use .gov
A
.gov website belongs to an official
government organization in the United States.
Secure .gov websites use HTTPS
A lock (
) or https:// means you've safely
connected to the .gov website. Share sensitive
information only on official, secure websites.
Gender‐specific sub‐group analysis of male patients depicting effects of the GLP‐1 analogues on T2DM patients. (A) Forest plot. (B) Publication bias funnel plot.