
Figure 1. Trial-by-trial variability and tuning in single neurons during visually evoked activity in the primary visual cortex (V1) of an awake mouse.
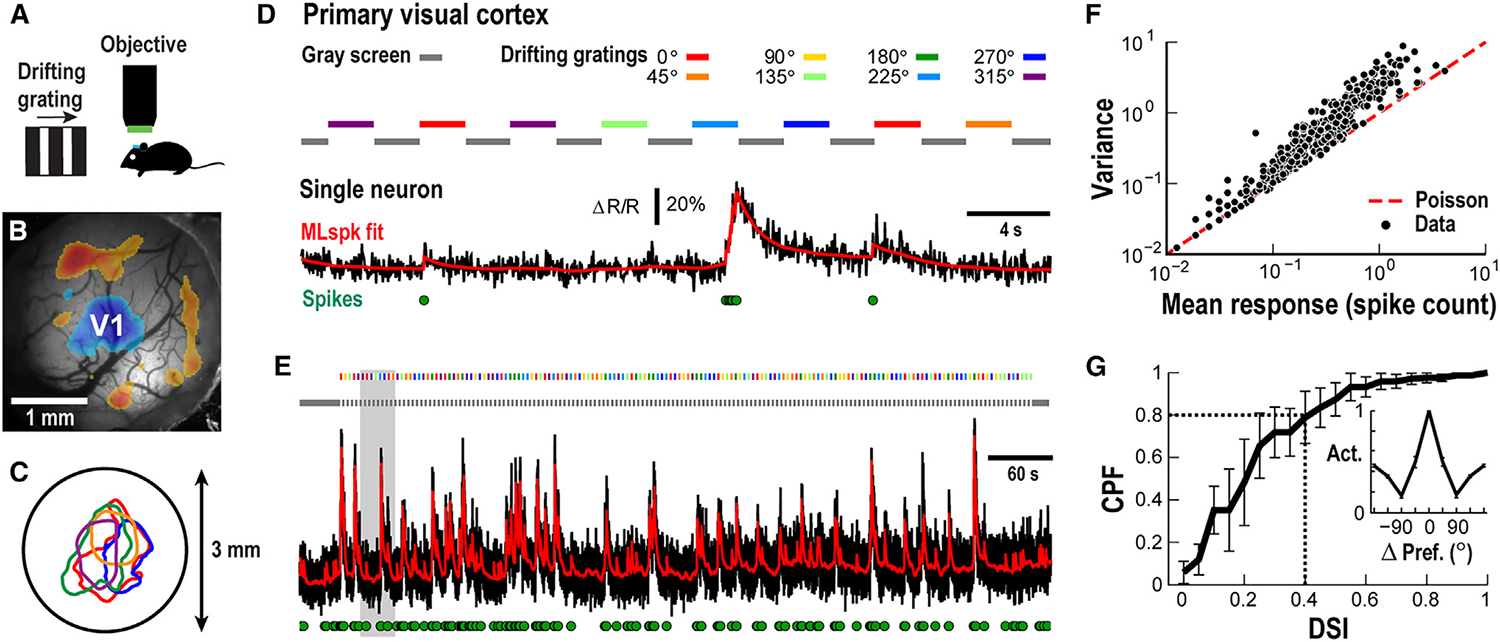
(A) Sketch of stimulation and head-fixed 2PI recording from an awake mouse.
(B) 3 mm craniotomy window with overlaid sign map identifying the V1 in blue (single mouse; see STAR Methods).
(C) Identified V1 patch for 5 different mice (colors) and their position relative to the 3 mm craniotomy window (circle).
(D) Variable response of a single V1 pyramidal neuron to semi-random presentation of 2 s large-field drifting gratings at 8 directions. Black: ΔR/R; red: MLspike fit of ΔR/R; green circles: estimated spikes (see STAR Methods). Color bars: stimulus direction. Gray bar: contrast-matched gray screen.
(E) Full recording of single neuron to semi-random presentation of 8 stimuli. Gray area: enlarged period shown in (D).
(F) Trial-by-trial variability of single neuron responses (dots; n = 228 cells across n = 7 animals), quantified by dividing response variance by response average, exceeds prediction from a Poisson process (red broken line).
(G) About 20% of responding neurons show a direction-selective index (DSI) above 0.4. Cumulative probability function (CPF) for n = 7 animals (mean ± SD). Inset: neurons with a DSI >0.4 show minimal response at orthogonal directions. Mean direction selectivity profile normalized to corresponding preferred direction (n = 47 cells; n = 7 animals; mean ± SD).