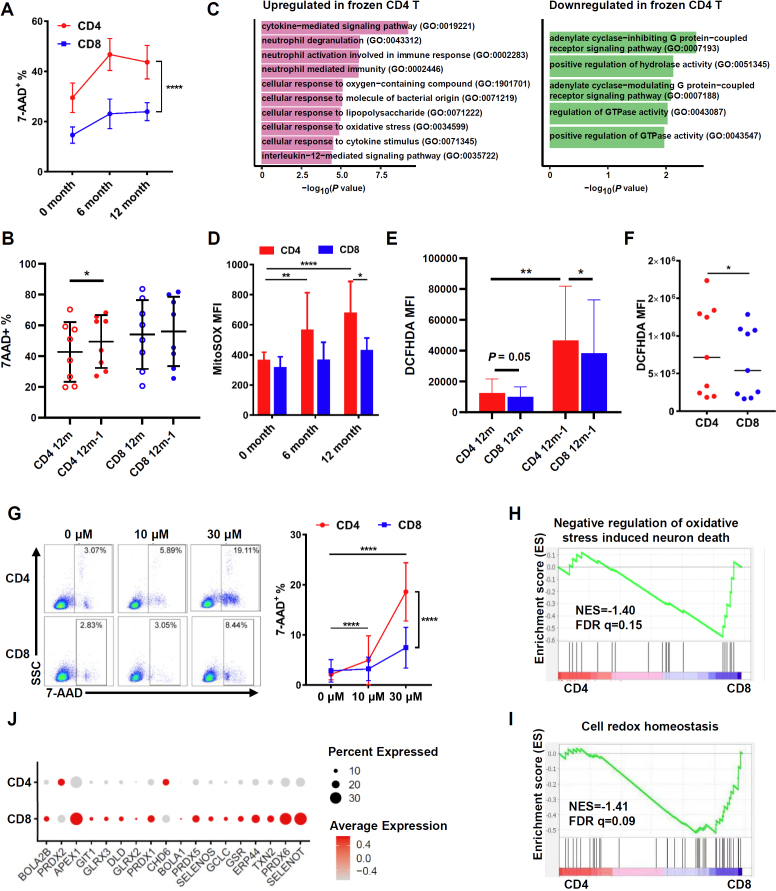
Figure 6.
Effects of long-term cryopreservation on T-cell apoptosis and the study on apoptosis mechanism. (A) The proportion of 7-AAD+ cells in CD4+ and CD8+ T cells in PBMC after long-term cryopreservation (n = 13). (B) The proportion of 7-AAD+ cells in CD4+ and CD8+ T cells in ascites after long-term cryopreservation (n = 8). (C) GO term enrichment of DEGs between cryopreserved and fresh CD4+ T cells. (D) Quantification of ROS level in CD4+ and CD8+ T cells in PBMC after long-term cryopreservation (n = 7). (E) The cytoplasmic ROS content of CD4+ and CD8+ T cells in ascites (n = 8). (F) The cytoplasmic ROS content of CD4+ and CD8+ T cells in fresh PBMCs (n = 9). (G) The proportion of 7-AAD+ cells in CD4+ and CD8+ T cells in PBMC after hydrogen peroxide stress (n = 8). (H-I) The gene set enrichment analysis (GSEA) to identify biological processes overrepresented in CD4+ T cells compared to CD8+ T cells. (J) Relative gene expression level of transcripts involved in cell redox homeostasis in CD4+ and CD8+ T cells. *P< 0.05; **P< 0.01; ****P< 0.0001. FDR q, false discovery rate q value; NES, normalized enrichment score.

