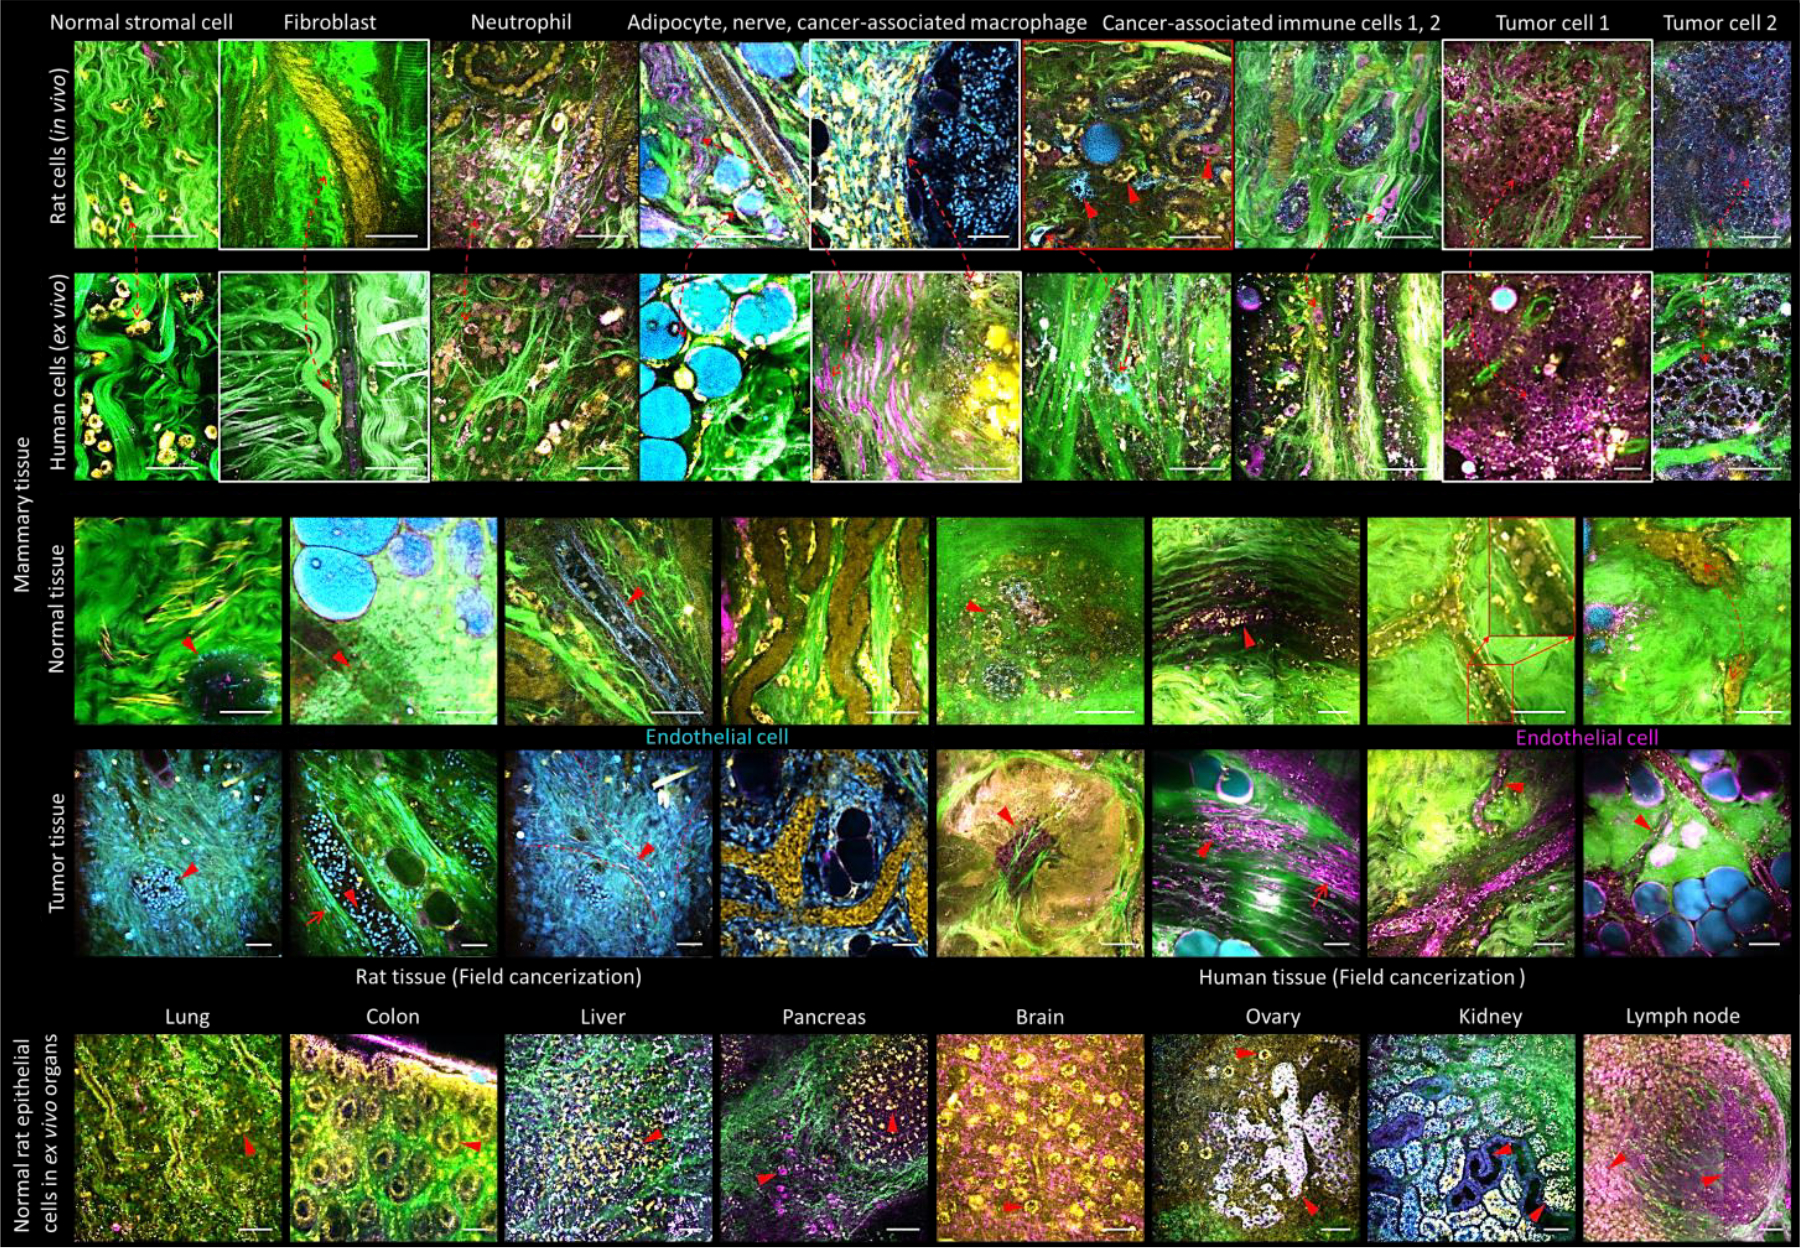
Figure 3.

Image atlas obtained by simultaneous label-free autofluorescence multiharmonic (SLAM) microscopy of various normal and cancer tissues from fresh, unstained human and rat biopsy specimens, in vivo and ex vivo, showing various endogenous contrast channels. Yellow: 2PF of FAD, Blue: 3PF of NAD(P)H, Green: SHG of fibrous structures (collagen), Magenta: THG of lipid-aqueous interfaces. Other colors appear based on the relative color mixing between the overlaid channels. Scale bars represent 25 μm.
