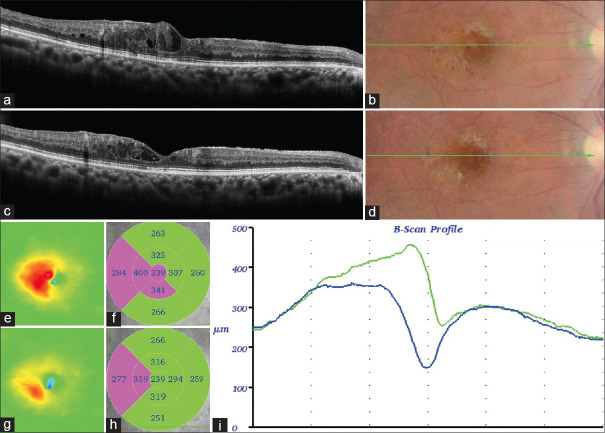
Figure 2.
Spectral-domain optical coherence tomography showing findings at the moment before treatment (a, b and e, f) and after 3-monthly loading dose of anti-vascular endothelial growth factor treatment (c, d and g, h). a and c: B-scan profile (horizontal); b and d: Color fundus photography; e and g: Color thickness map; f and h: ETDRS subfields; i: B-scan thickness before (green line) and after (blue line) treatment

