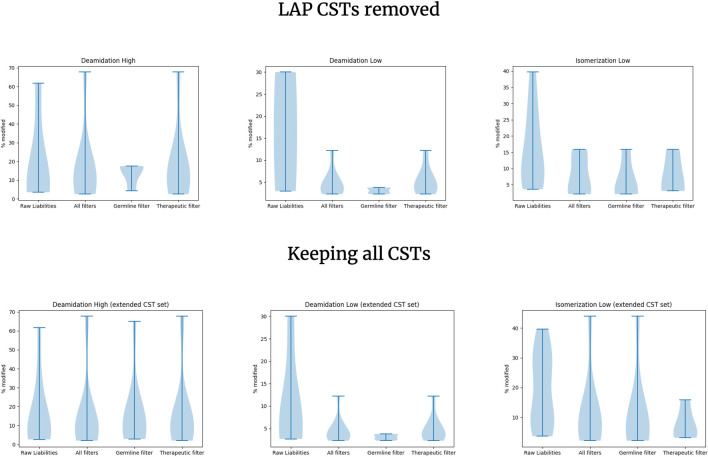
Fig 7. Benchmarking the predictive ability of the Liability Antibody Profiler (LAP) flags to filter innocuous liabilities.
The y axis shows the distribution of the percentage of each liability undergoing modification. In most cases, liabilities are associated with one or more LAP flags. We only show the germline and therapeutic flag individual distributions as no liabilities in the Lu et al. Isomerization/Deamidation dataset and Liability dataset were detected to be buried. “CST” stands for Clinical Stage Therapeutics.

