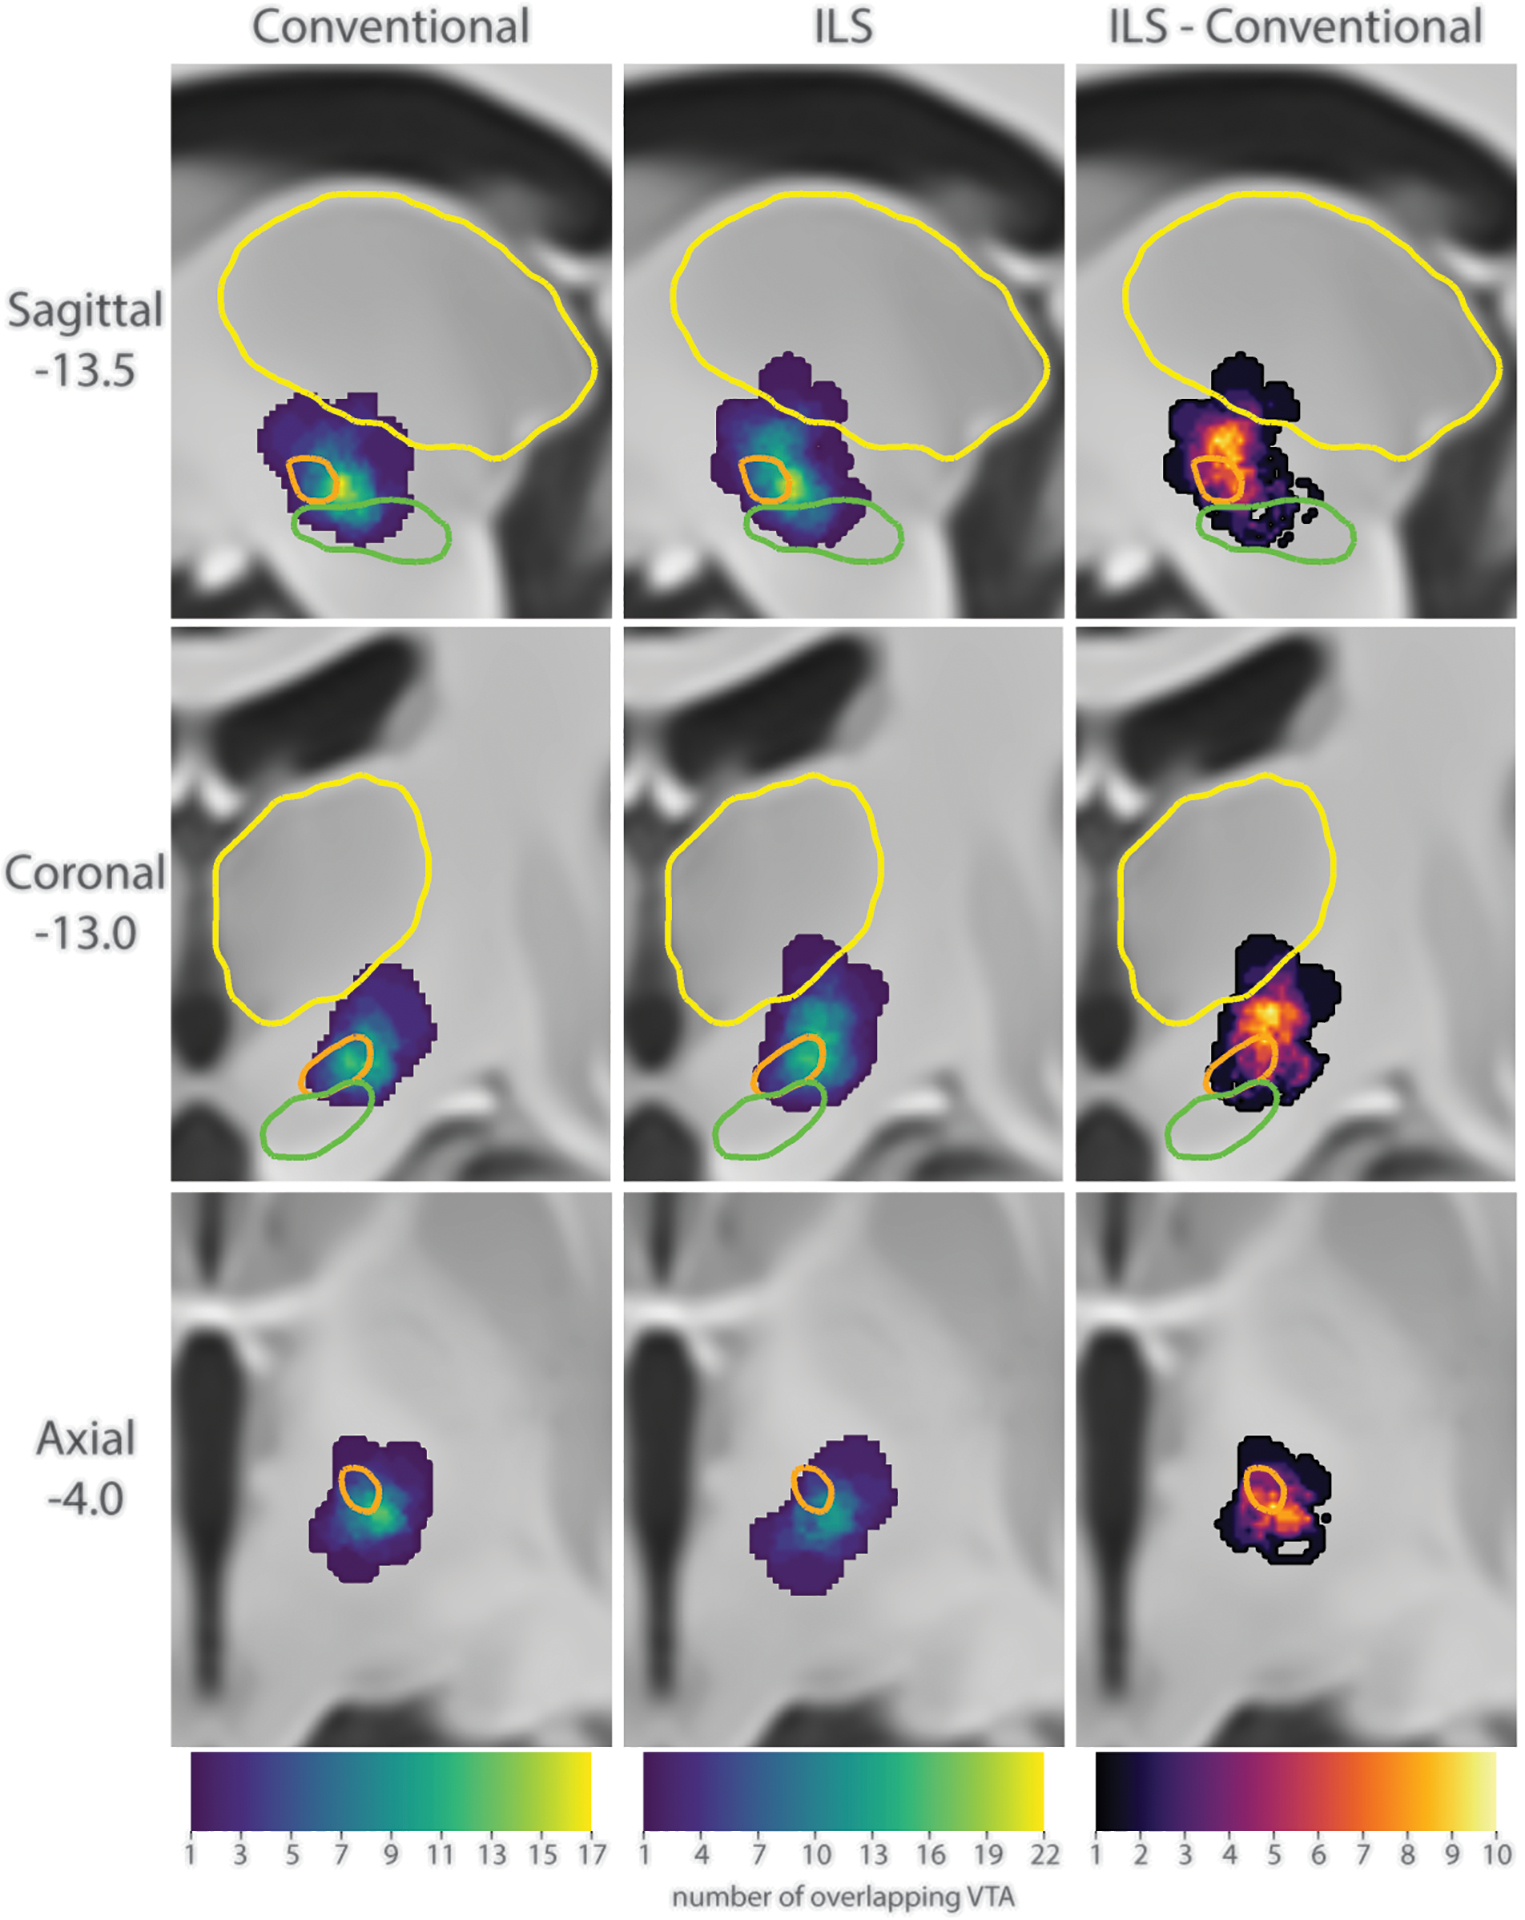
Figure 2.

Comparison of the location of activation between conventional and ILS stimulation. Left: Sum of the VTA from the initial conventional programming setting. Center: Sum of the VTA from the ILS programming setting. Right: Sum of the areas of areas that were activated during ILS stimulation, but not during conventional stimulation. Colors: orange = STN, green = substantia nigra, yellow = thalamus.
