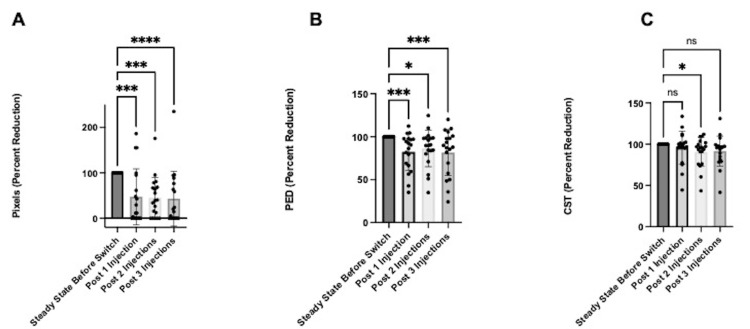
Figure 2. Anatomic changes in eyes with all fluid types (n=19) at one, two, and three injections relative to steady state. The data has been represented in mean percent reduction +/- SD (A) TFA in pixels, (B) PED, and (C) CST.
*p<0.05, **p<0.01, ***p<0.005, ****p<0.001
CST: central subfield thickness, PED: pigment epithelial detachment, TFA: total fluid area reduction

